Mixpanel
Enabling faster data-driven decisions with Root Cause Analysis
Helping product teams quickly diagnose key metrics changes in Mixpanel to provide clarity and confidence.
Mixpanel
Enabling faster data-driven decisions with Root Cause Analysis
Helping product teams quickly diagnose key metrics changes in Mixpanel to provide clarity and confidence.
Mixpanel
Enabling faster data-driven decisions with Root Cause Analysis
Helping product teams quickly diagnose key metrics changes in Mixpanel to provide clarity and confidence.
Mixpanel
Enabling faster data-driven decisions with Root Cause Analysis
Helping product teams quickly diagnose key metrics changes in Mixpanel to provide clarity and confidence.
Helping product teams quickly diagnose key metrics changes in Mixpanel to provide clarity and confidence.
Context & Discovery
The Problem
Unexpected trends in product-usage data happen. People turn to Mixpanel to uncover the reason why.
However, understanding the cause of unexpected disruptions in data is a manual, time-intensive process for users

Key Question
How might we help product teams diagnose the root cause of key metric changes, so that they are able to quickly & effectively take action.
Goals
- Business goals:
- Increase retention by bringing more value to users & providing an opportunity to pull users back into the product
- Improve sales win rate. In 2023, there were 8 instances where the absence of a solution to the root cause analysis workflow deterred a key Enterprise customer from partnering with Mixpanel.
- Product goals:
- Speed up time to value by removing manual & complex steps in a common and high-risk workflow.
- Provide actionable insights during potential crisis. At it's core Mixpanel is a tool built to answer questions – we shouldn't be creating new loose ends without providing the tools to wrap them up.
Facing Constraints & Complexity
- Our team was faced with an execution timeline of under a month
- Related features were facing simultaneous changes, creating a need for us to navigate dependencies carefully.
Solution Approach
My team delivered a simple and effective workflow to fill the gaps users were experiencing.
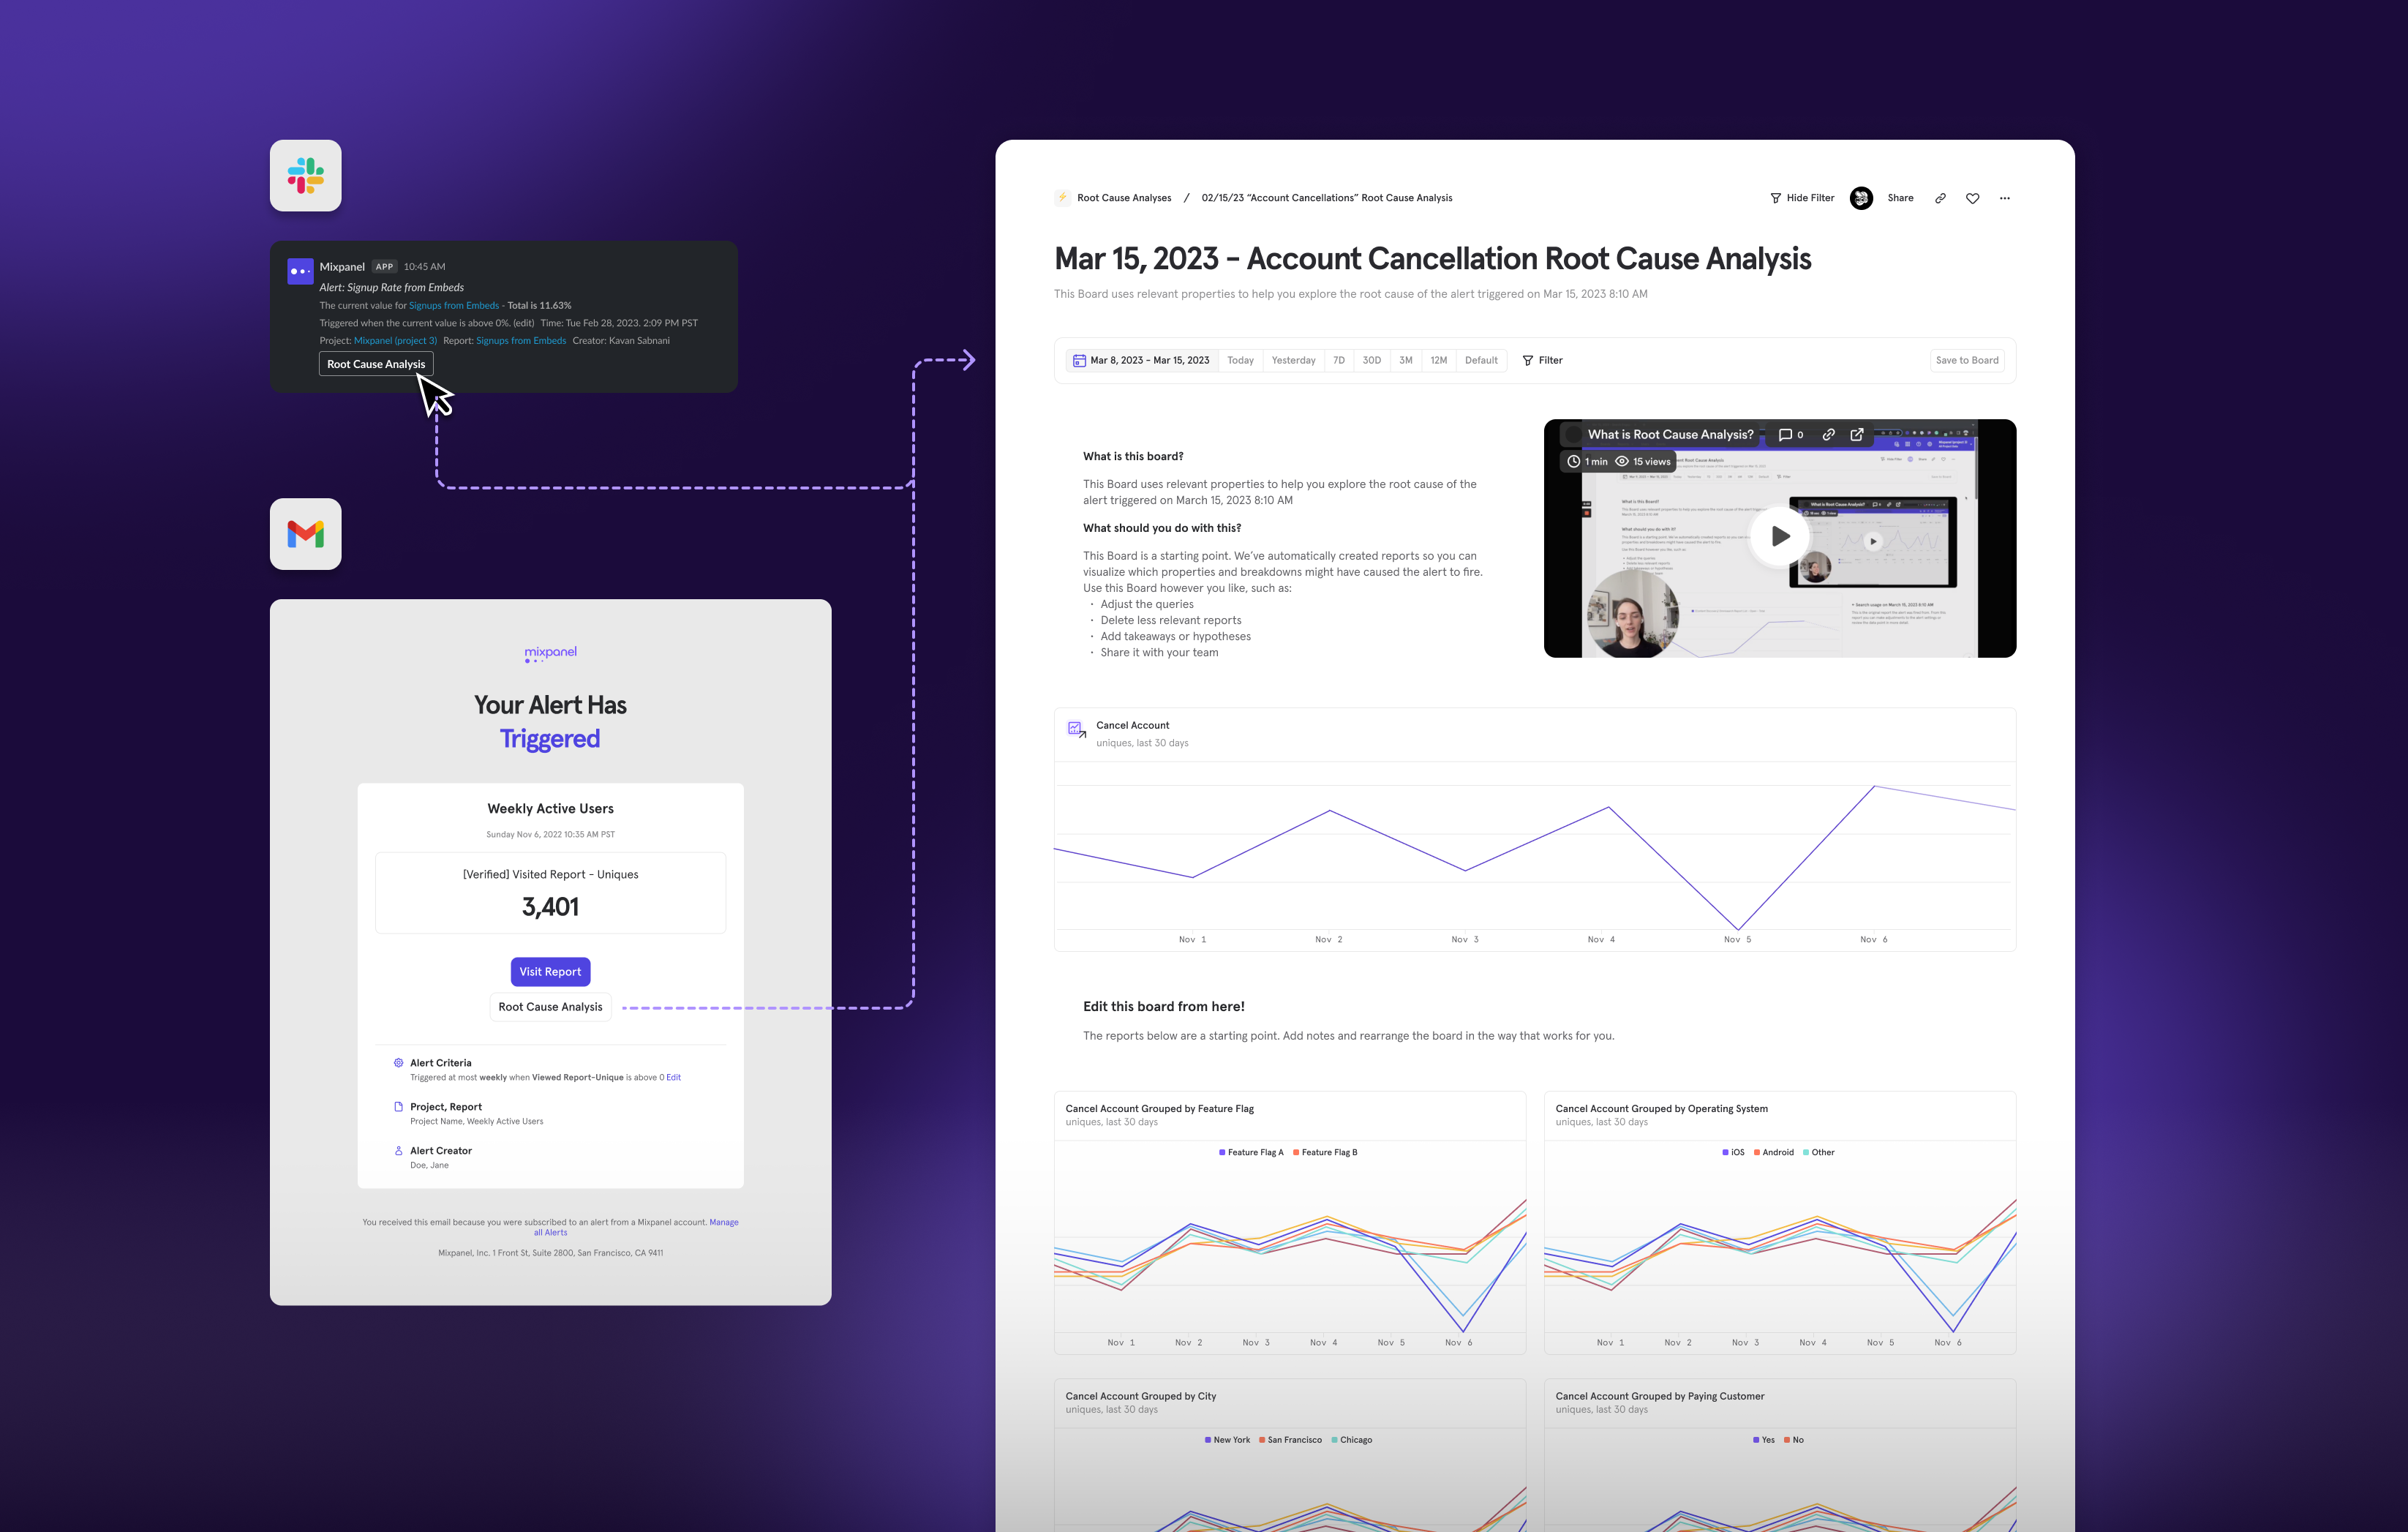
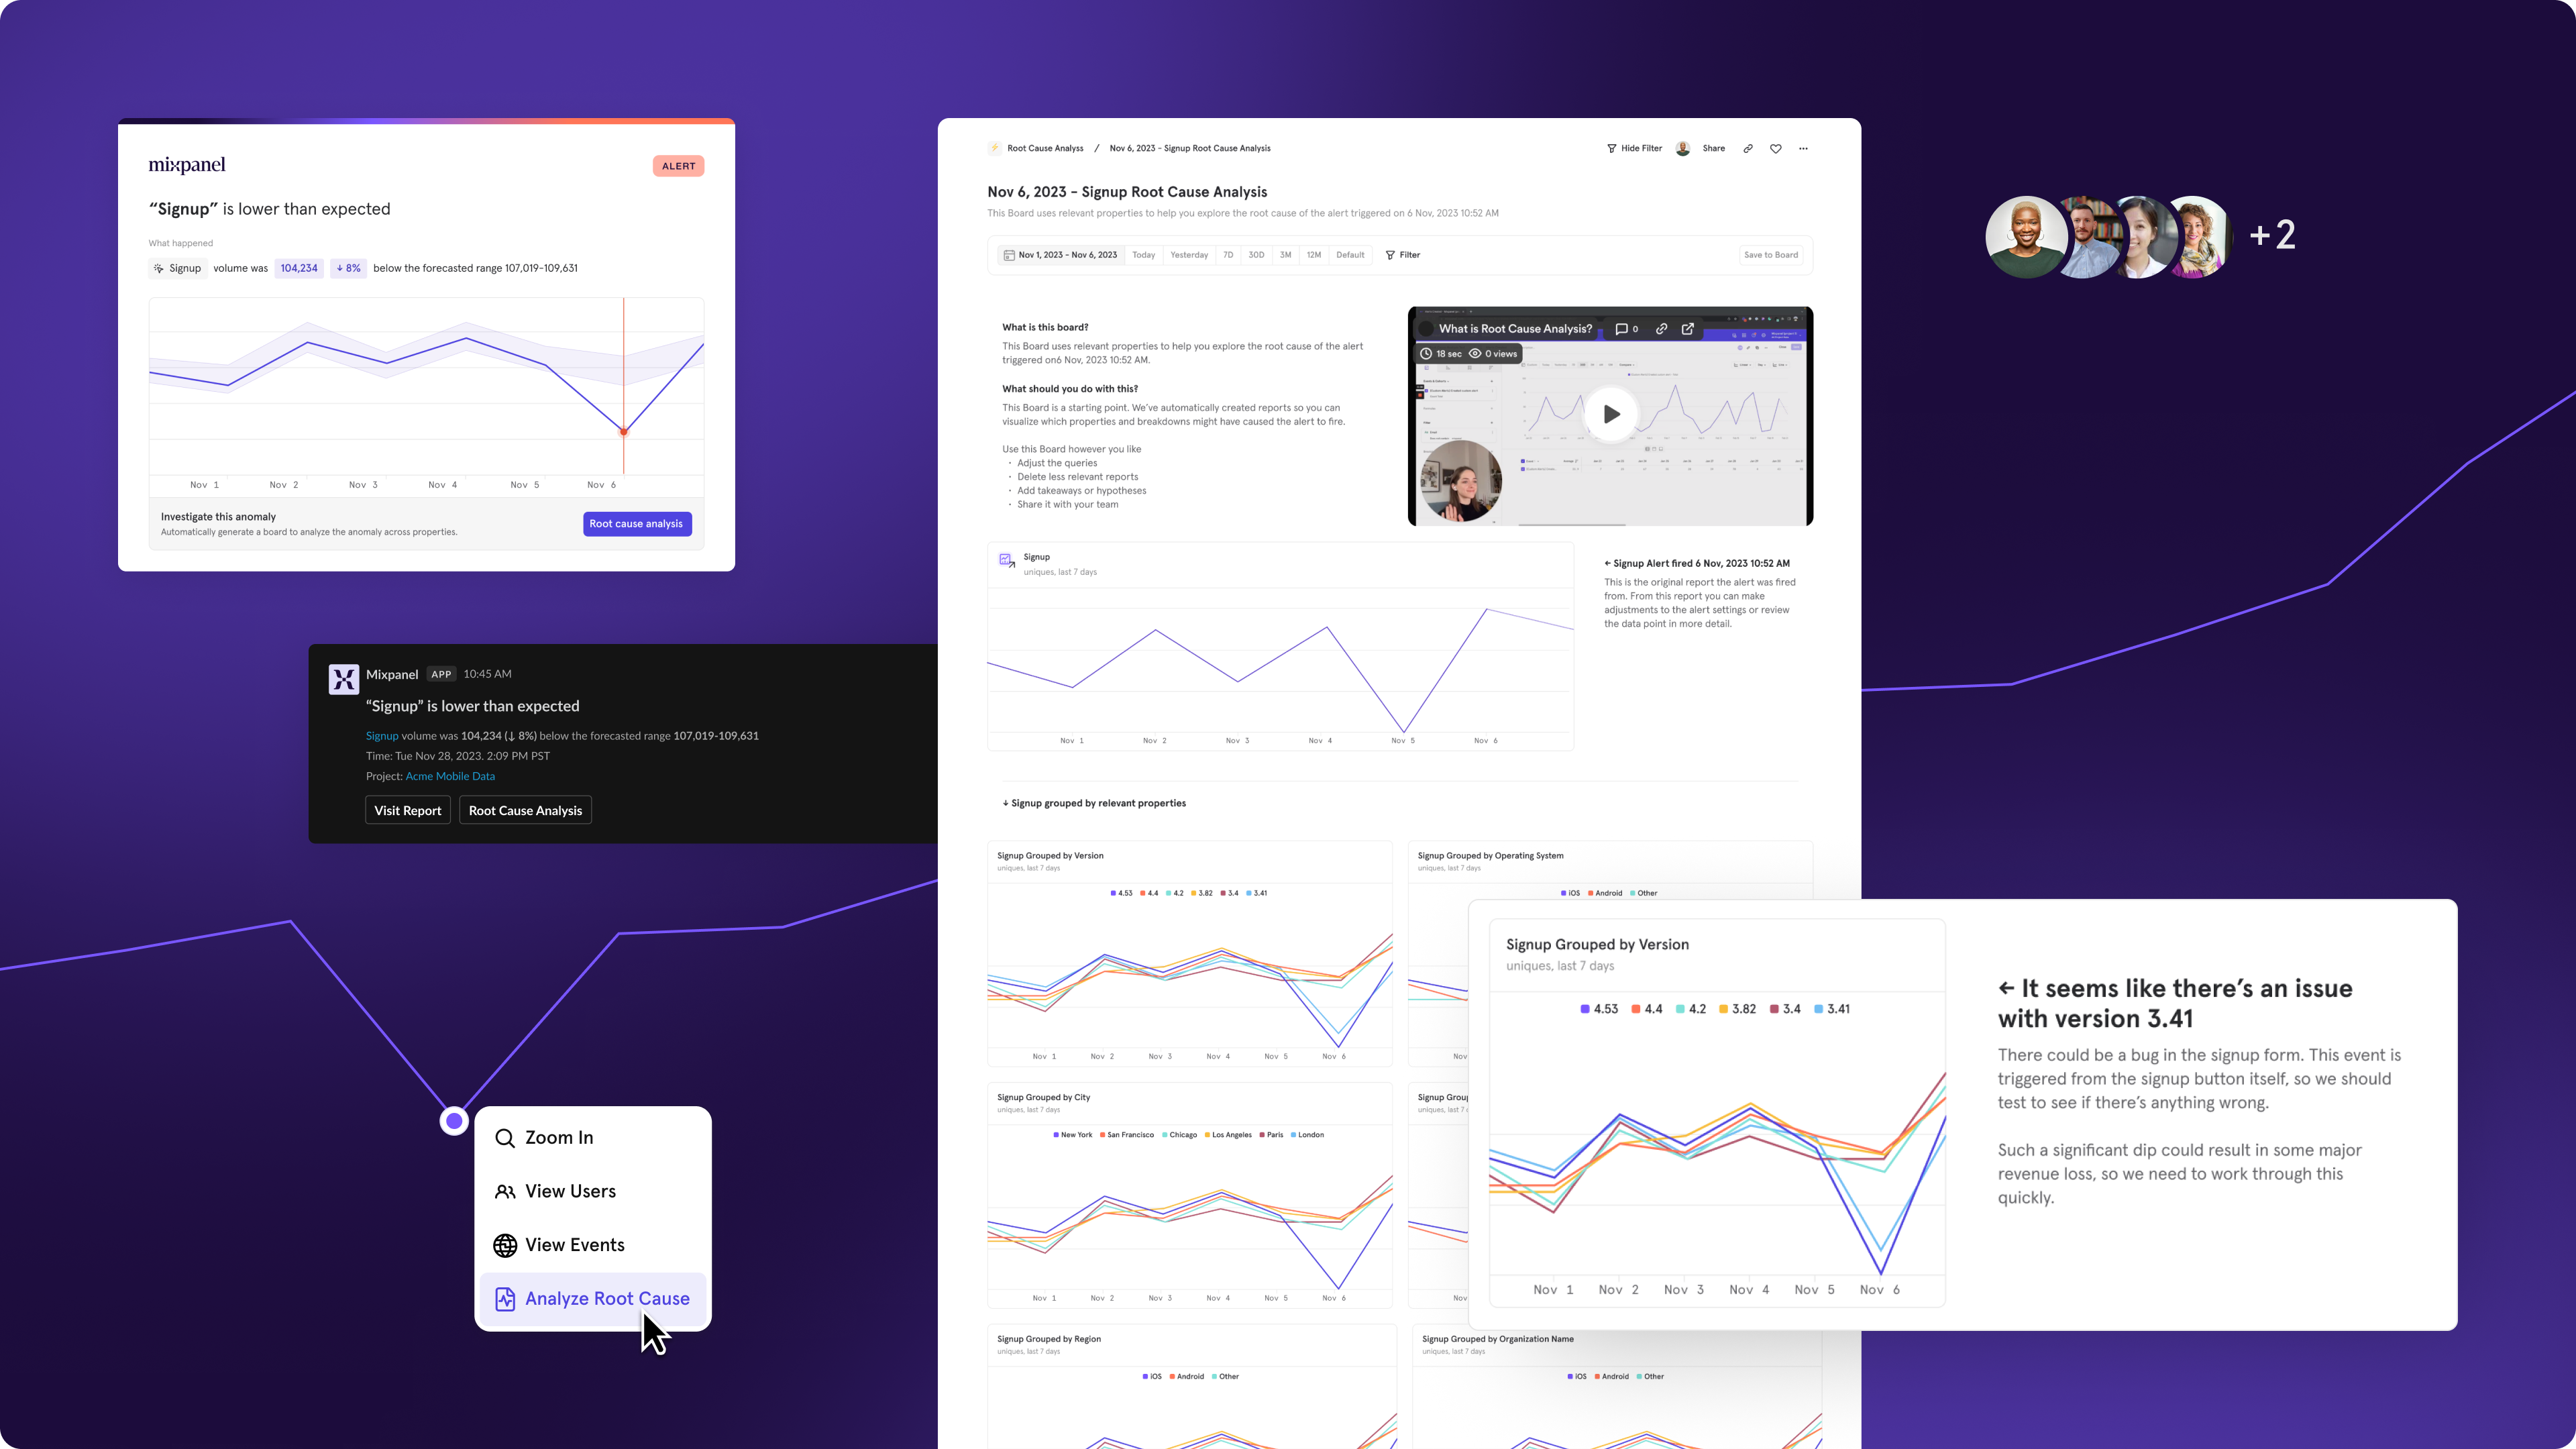
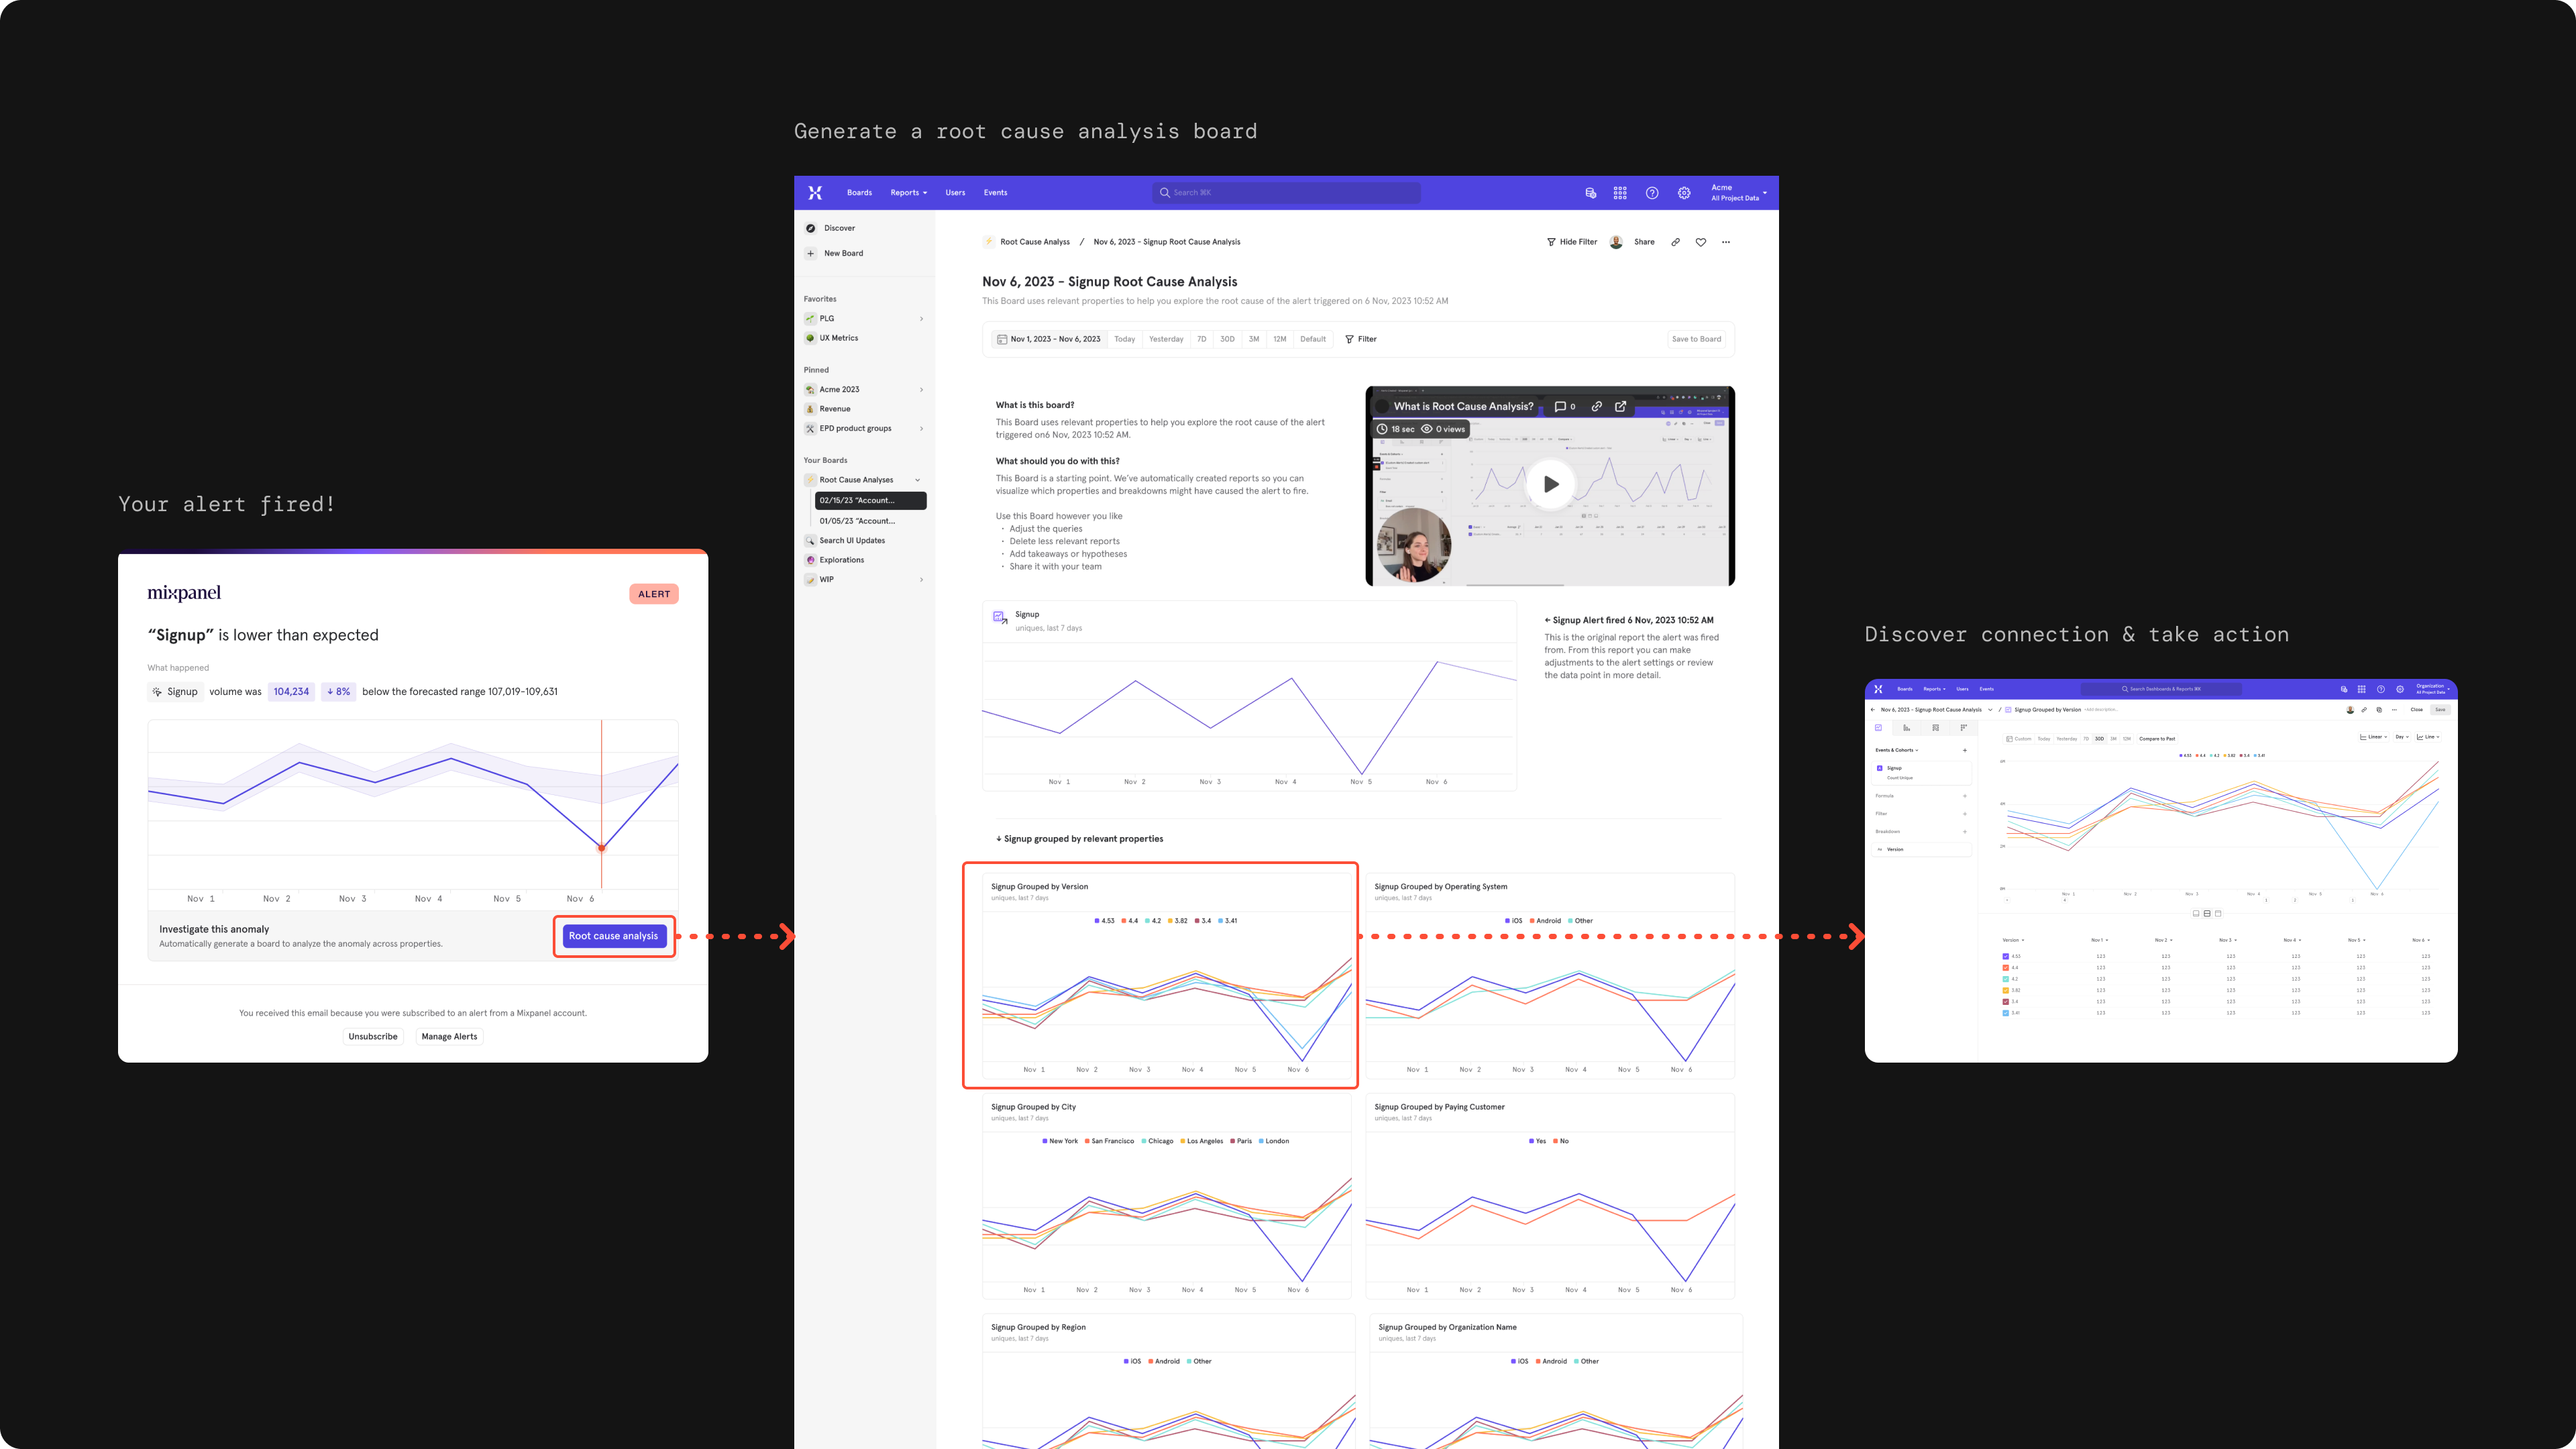
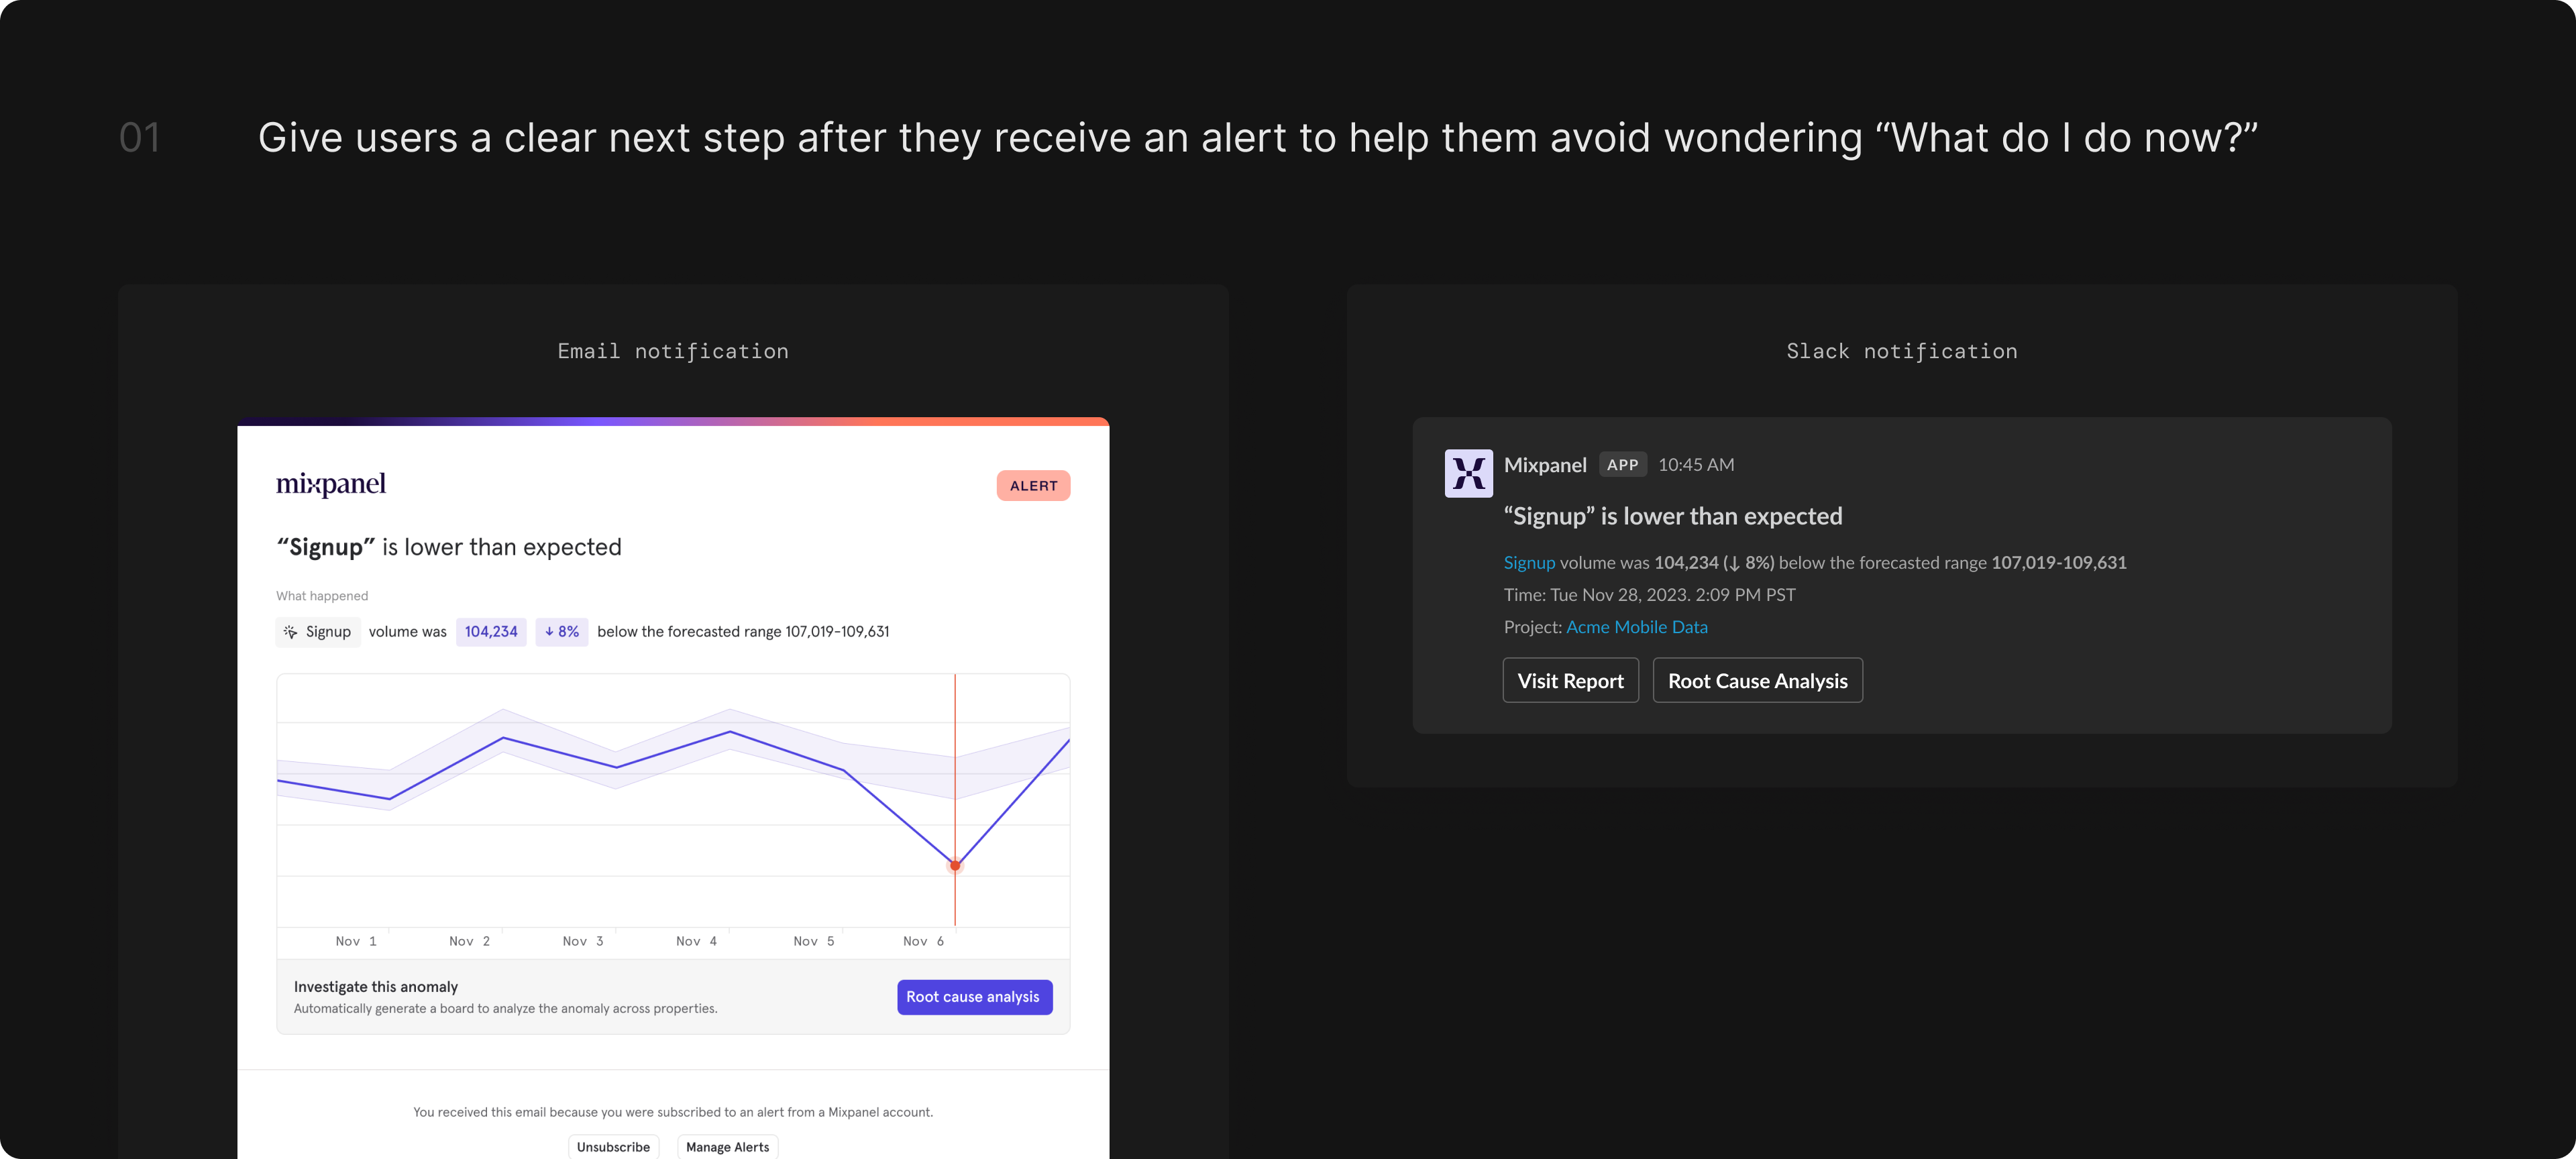
- Building off my work on anomaly detection alerts, we introduced an entry point to generate a root cause analysis report when a user received a notification about unexpected trends in their product usage data.
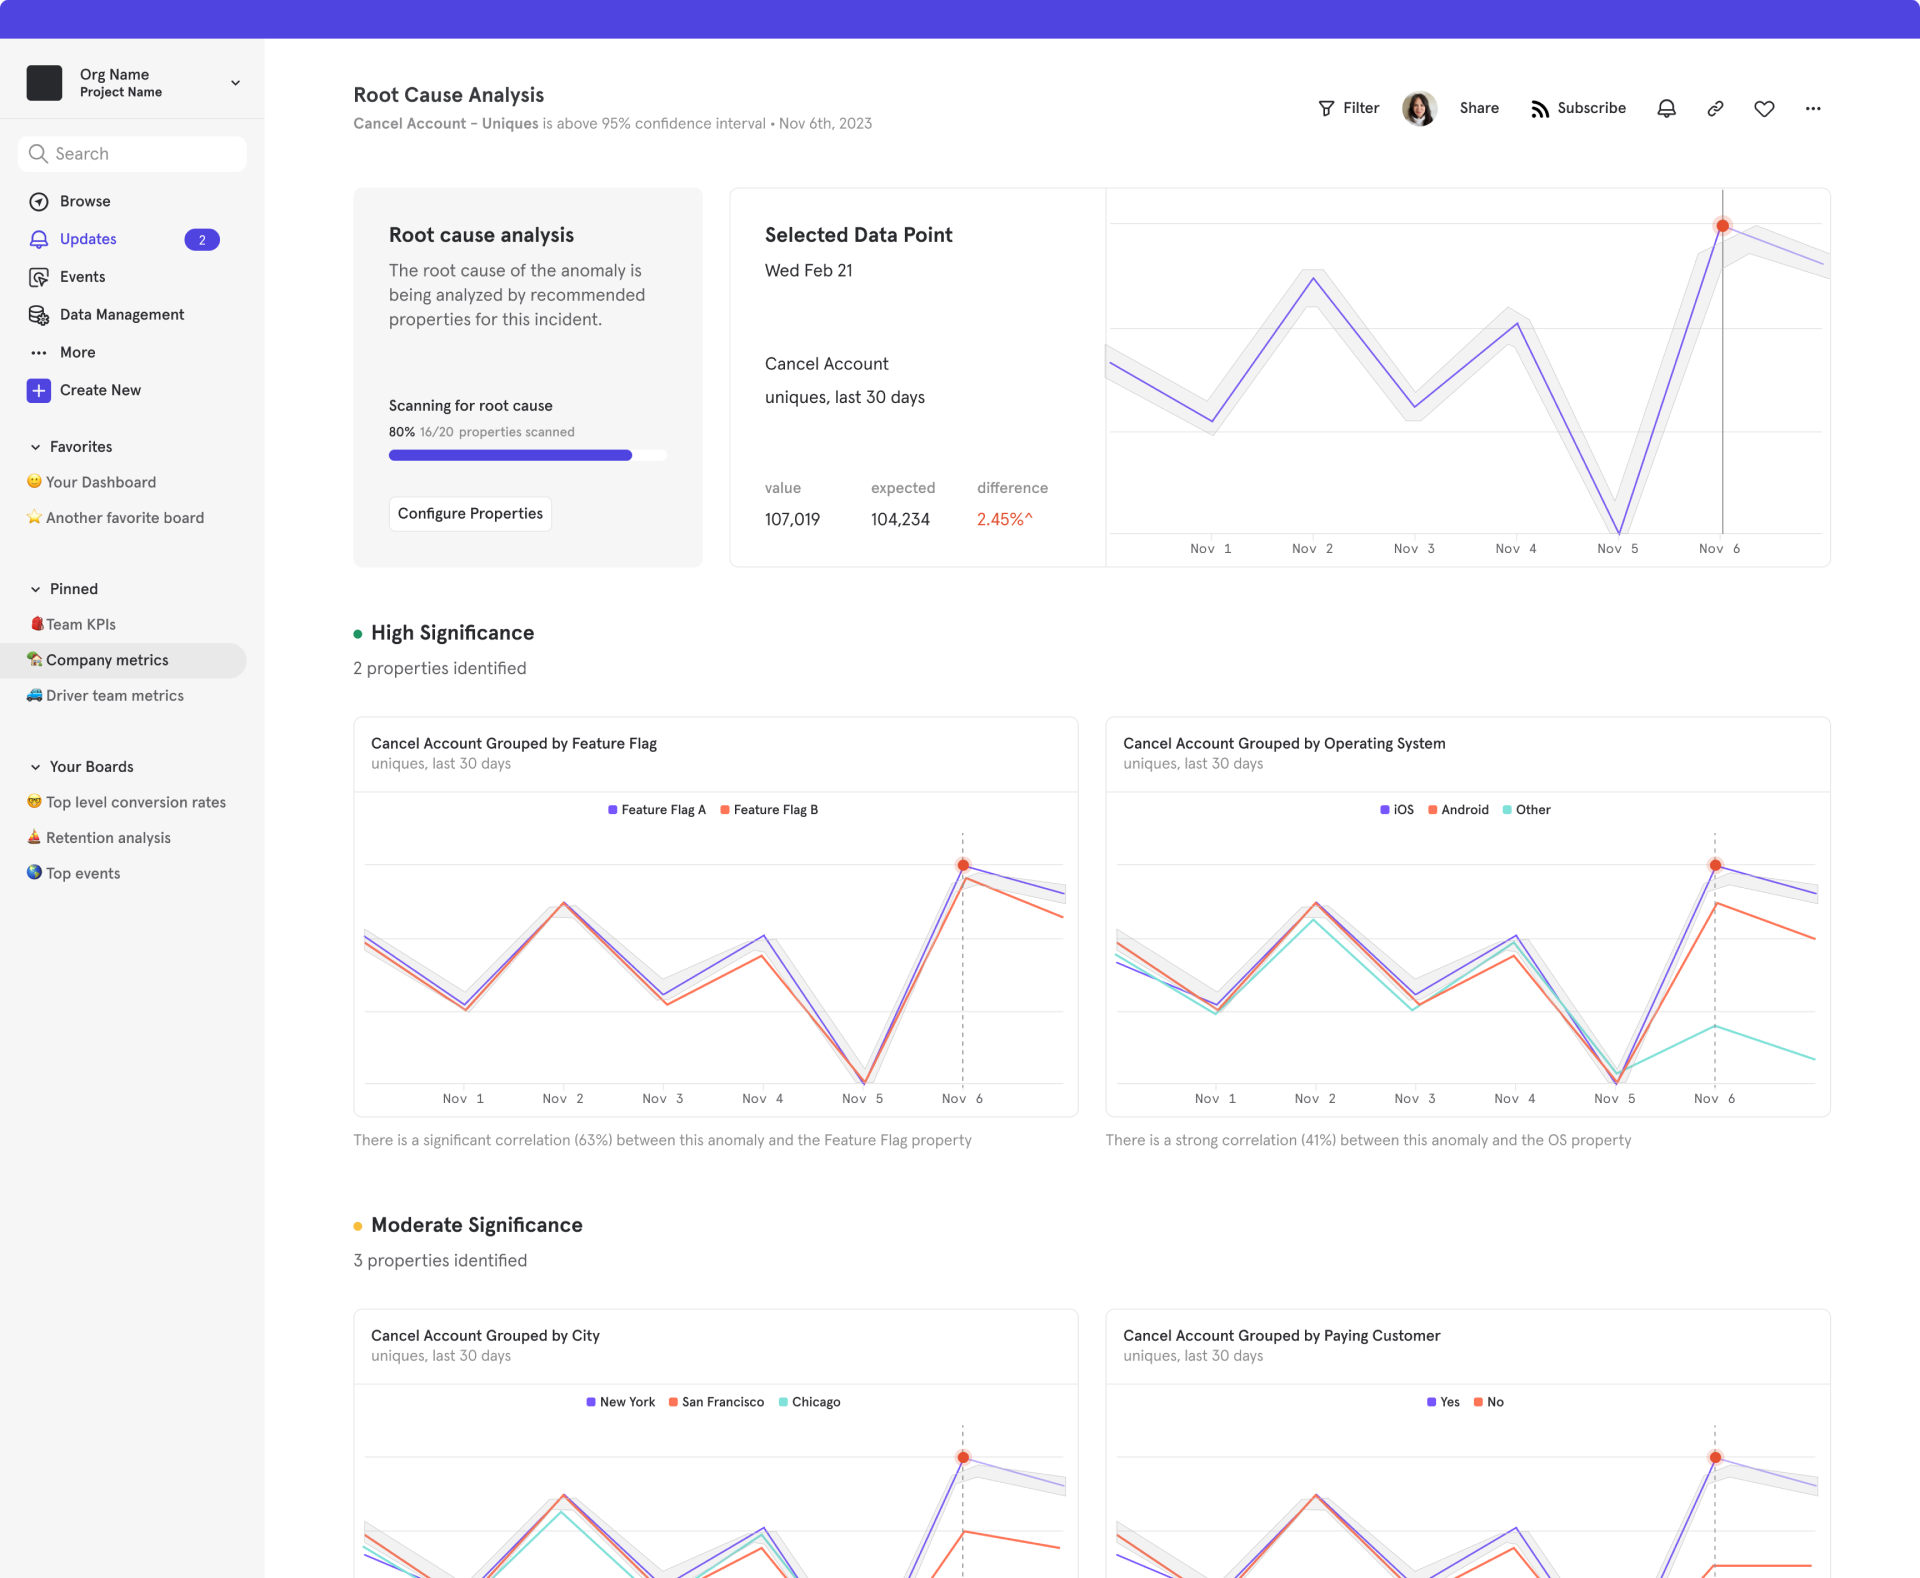
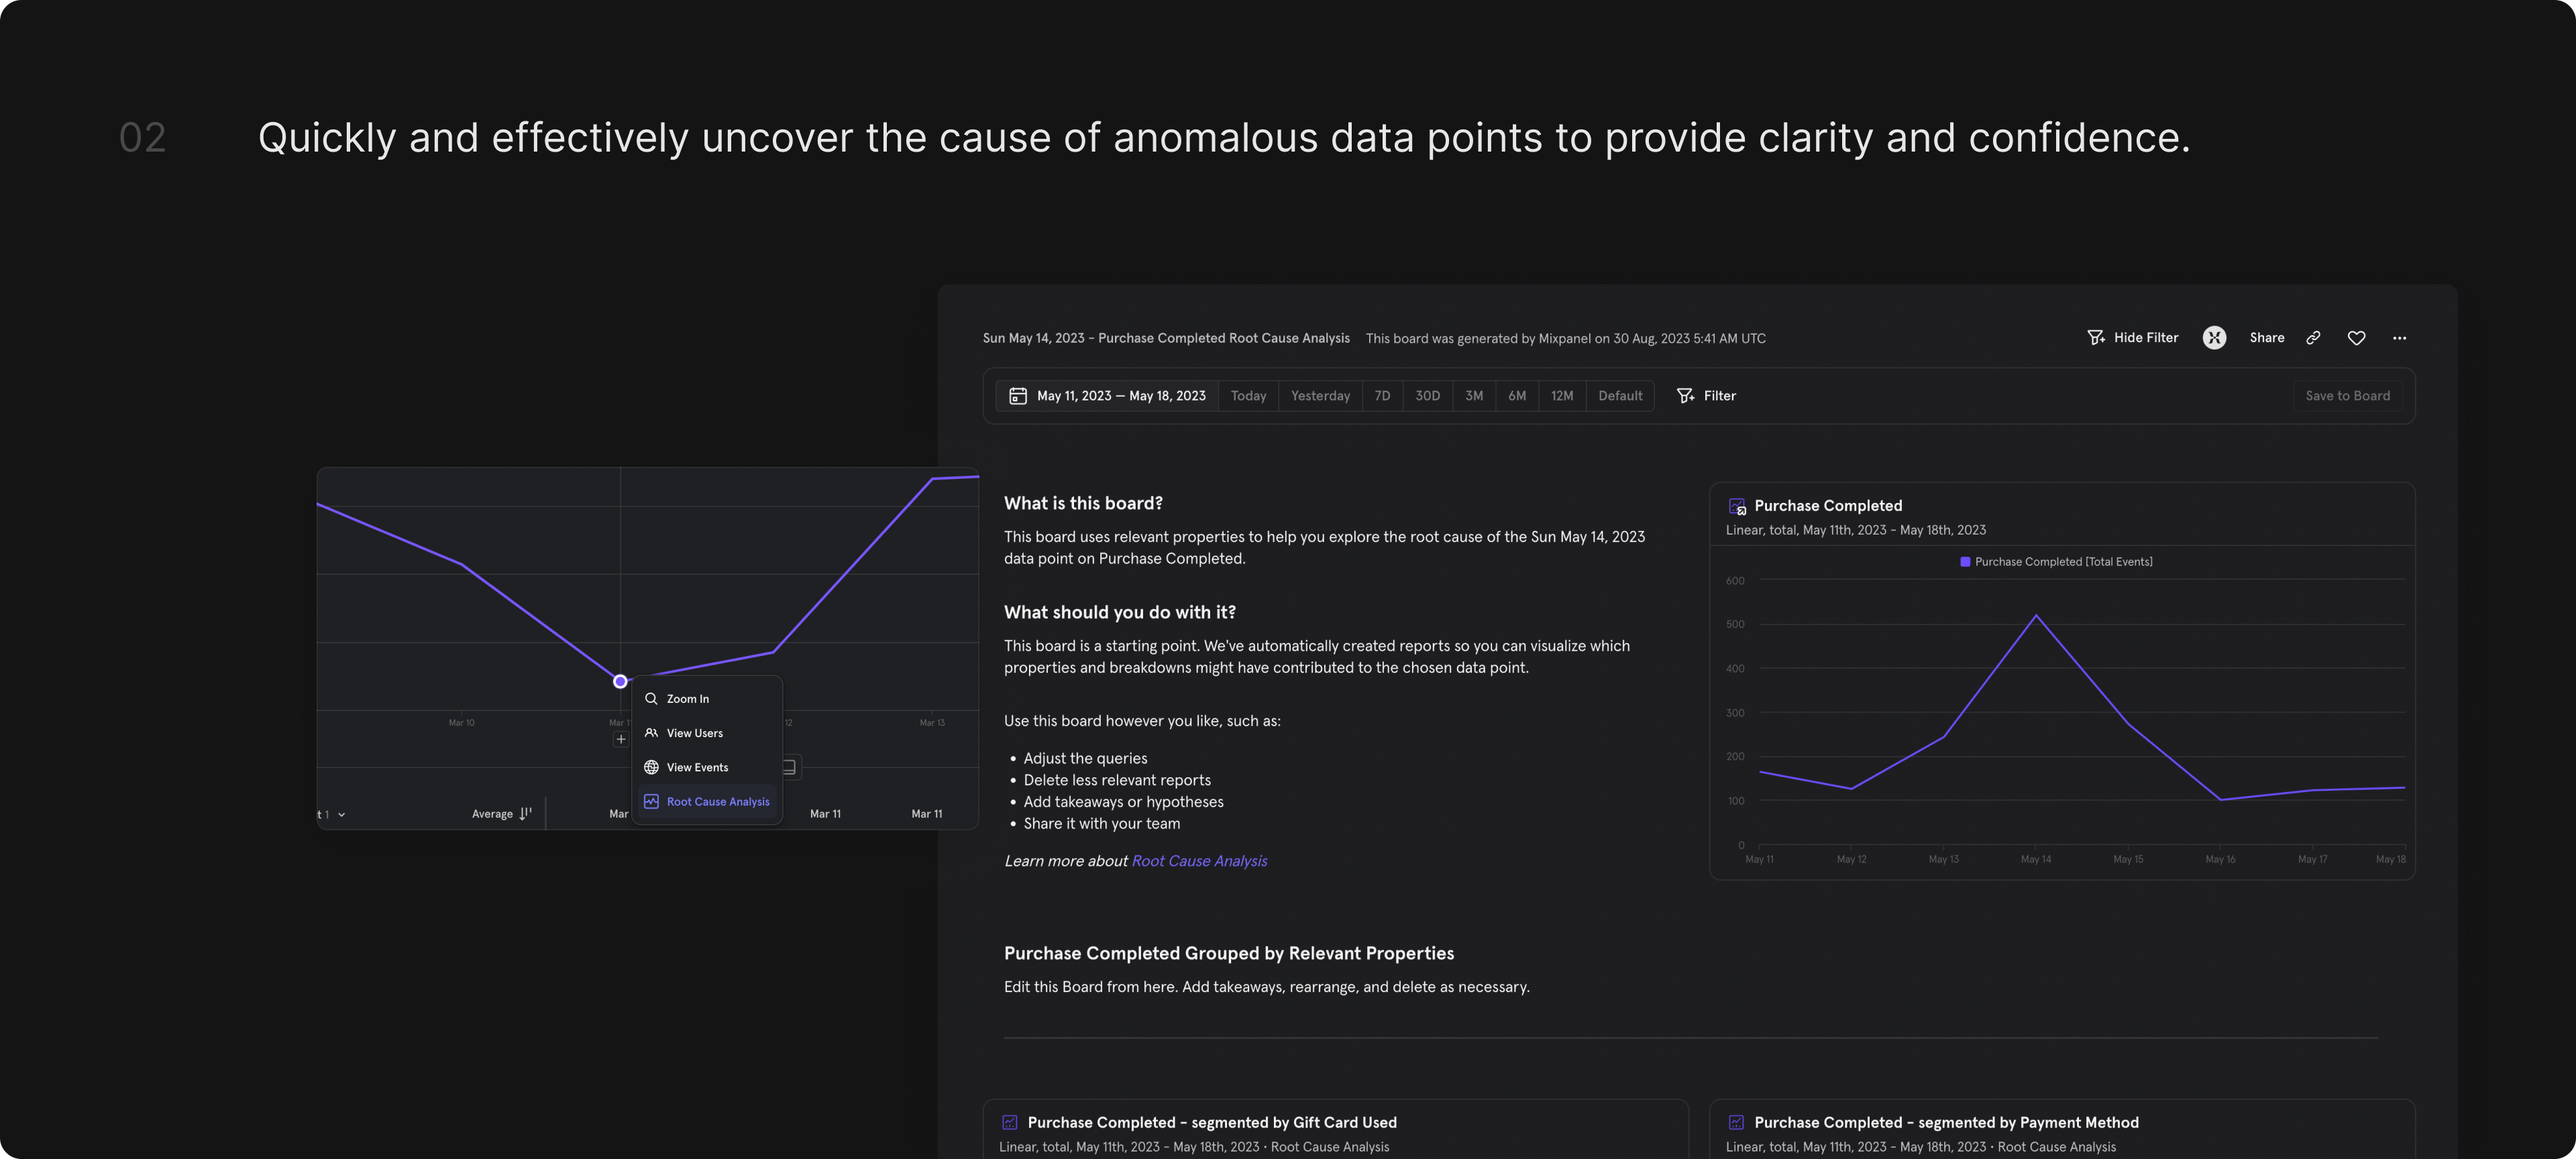
- Users are then able to uncover the cause of anomalous data points with the use of an automatically generated dashboard.
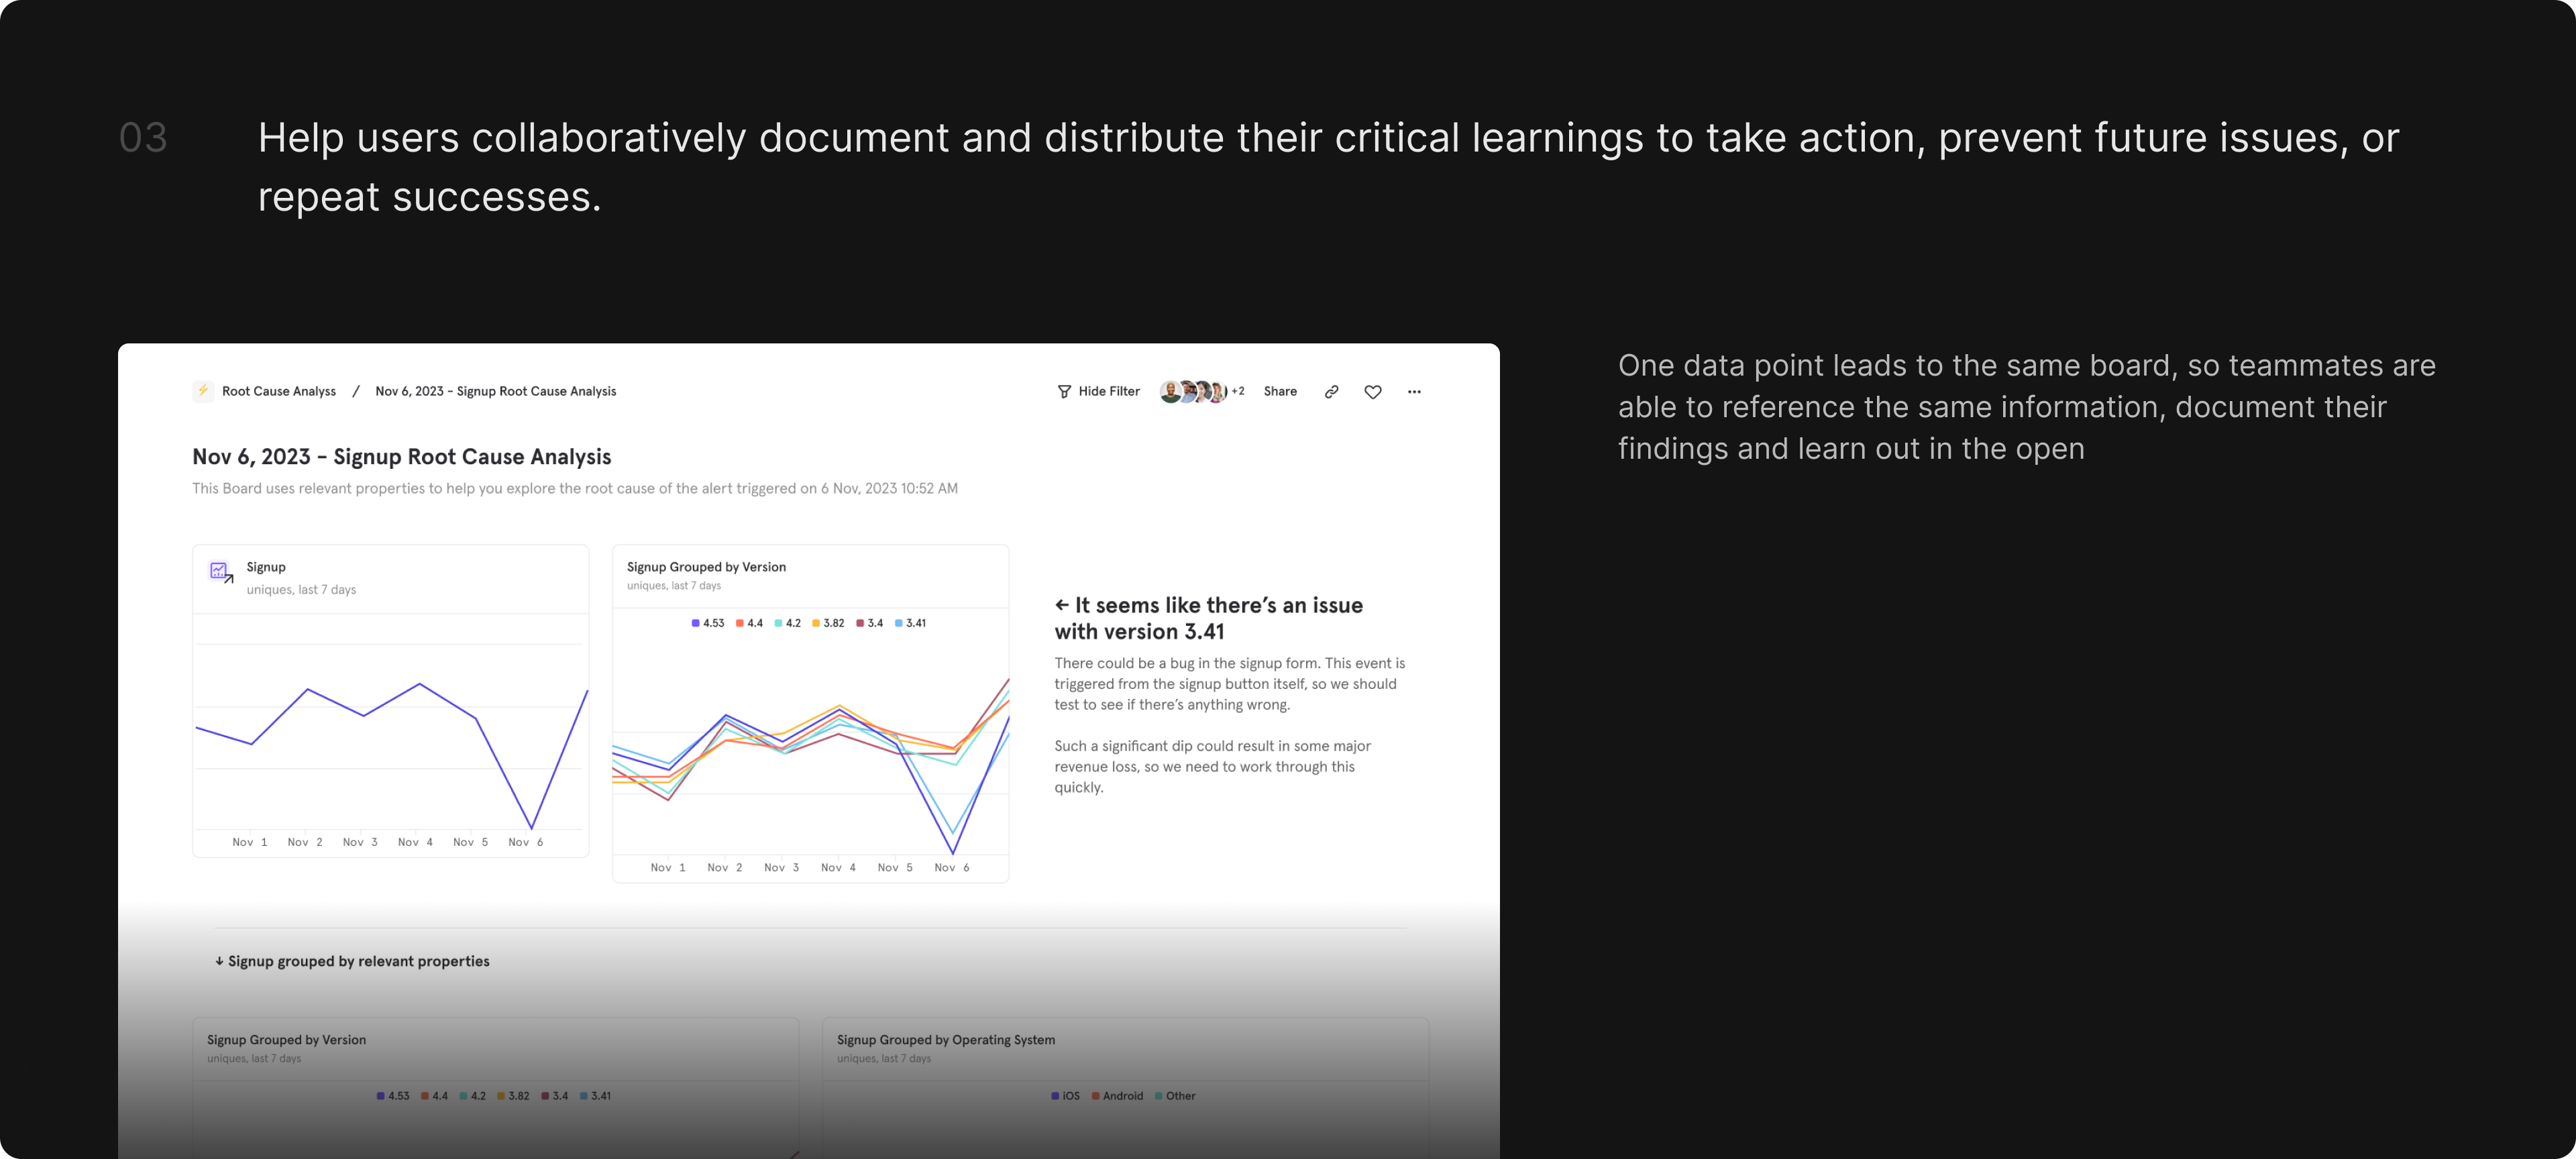
- Users are able to explore causation & collaboratively document and distribute their critical learnings to take action, prevent issues, or repeat successes.
Take a peek at the final results


Heading 1
Heading 2
Heading 3
Heading 4
Heading 5
Heading 6
Lorem ipsum dolor sit amet, consectetur adipiscing elit, sed do eiusmod tempor incididunt ut labore et dolore magna aliqua. Ut enim ad minim veniam, quis nostrud exercitation ullamco laboris nisi ut aliquip ex ea commodo consequat. Duis aute irure dolor in reprehenderit in voluptate velit esse cillum dolore eu fugiat nulla pariatur.
Block quote
Ordered list
- Item 1
- Item 2
- Item 3
Unordered list
- Item A
- Item B
- Item C
Bold text
Emphasis
Superscript
Subscript
Process
Research
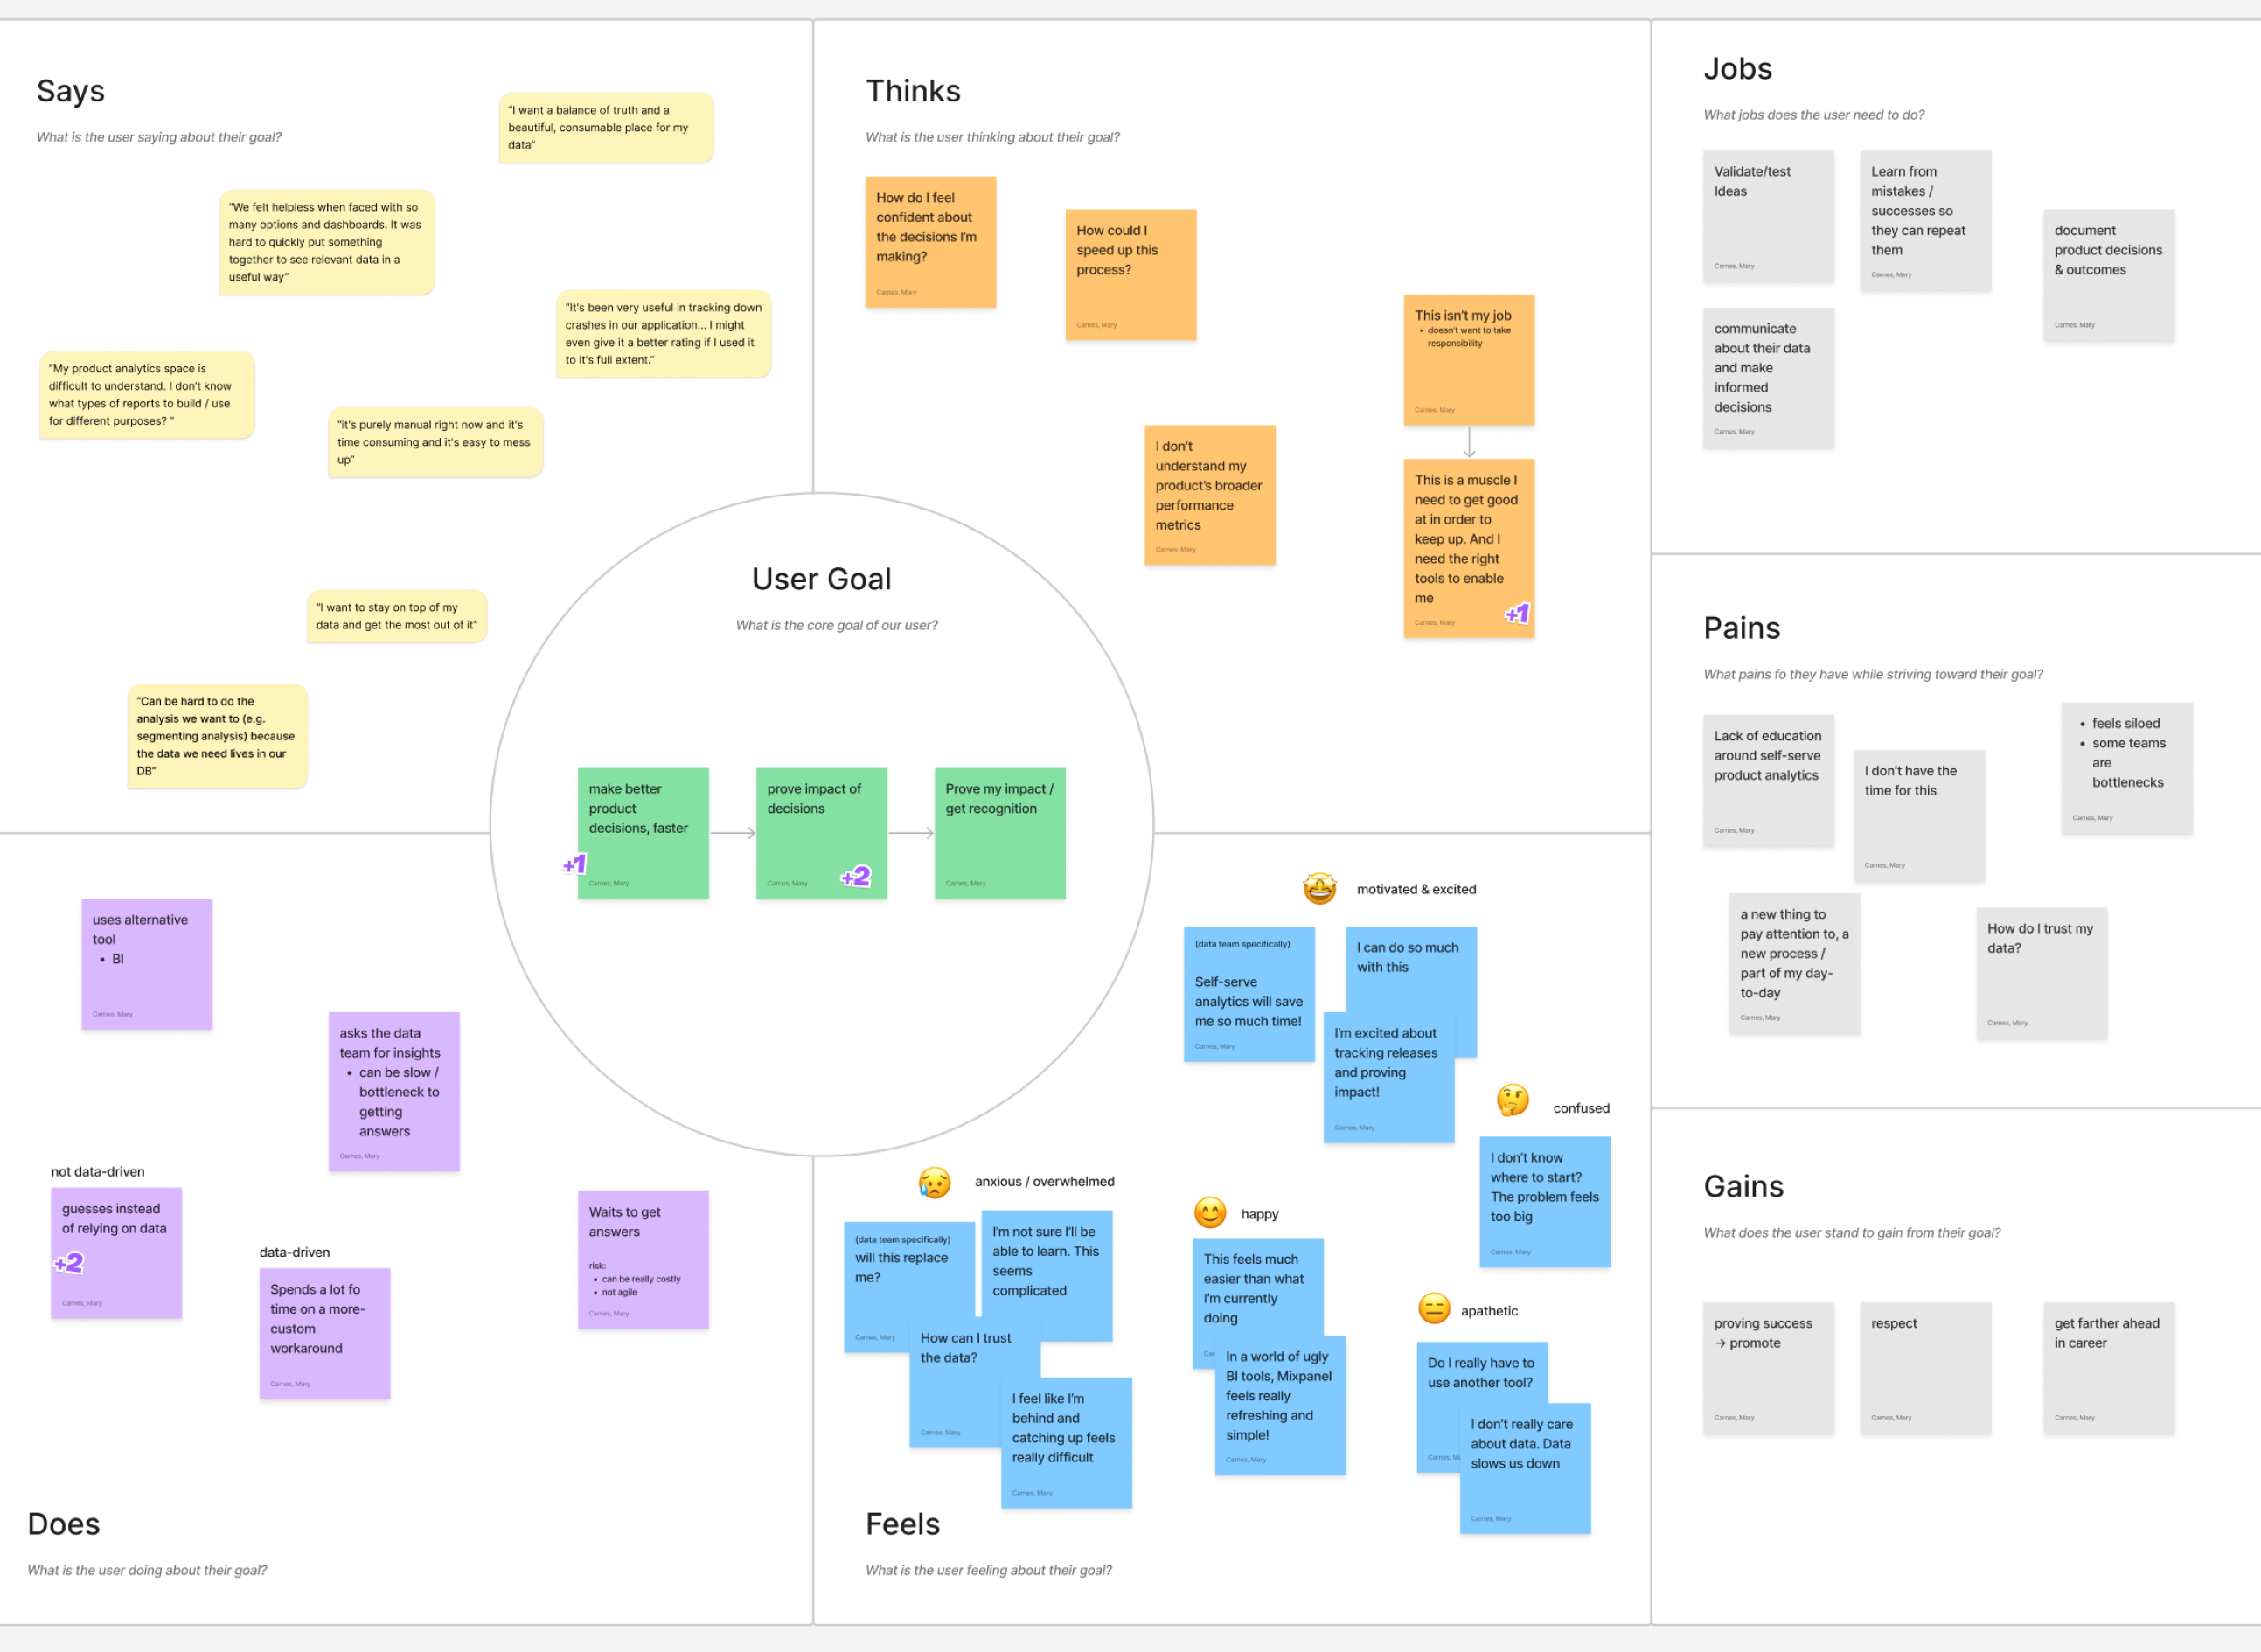
I began by collecting quantitative usage data to understand the key metrics we were trying to drive. I also planned and lead 8 user interviews to identify key user needs. I integrated research throughout my design process to validate decisions and ensure our solution was making impact.
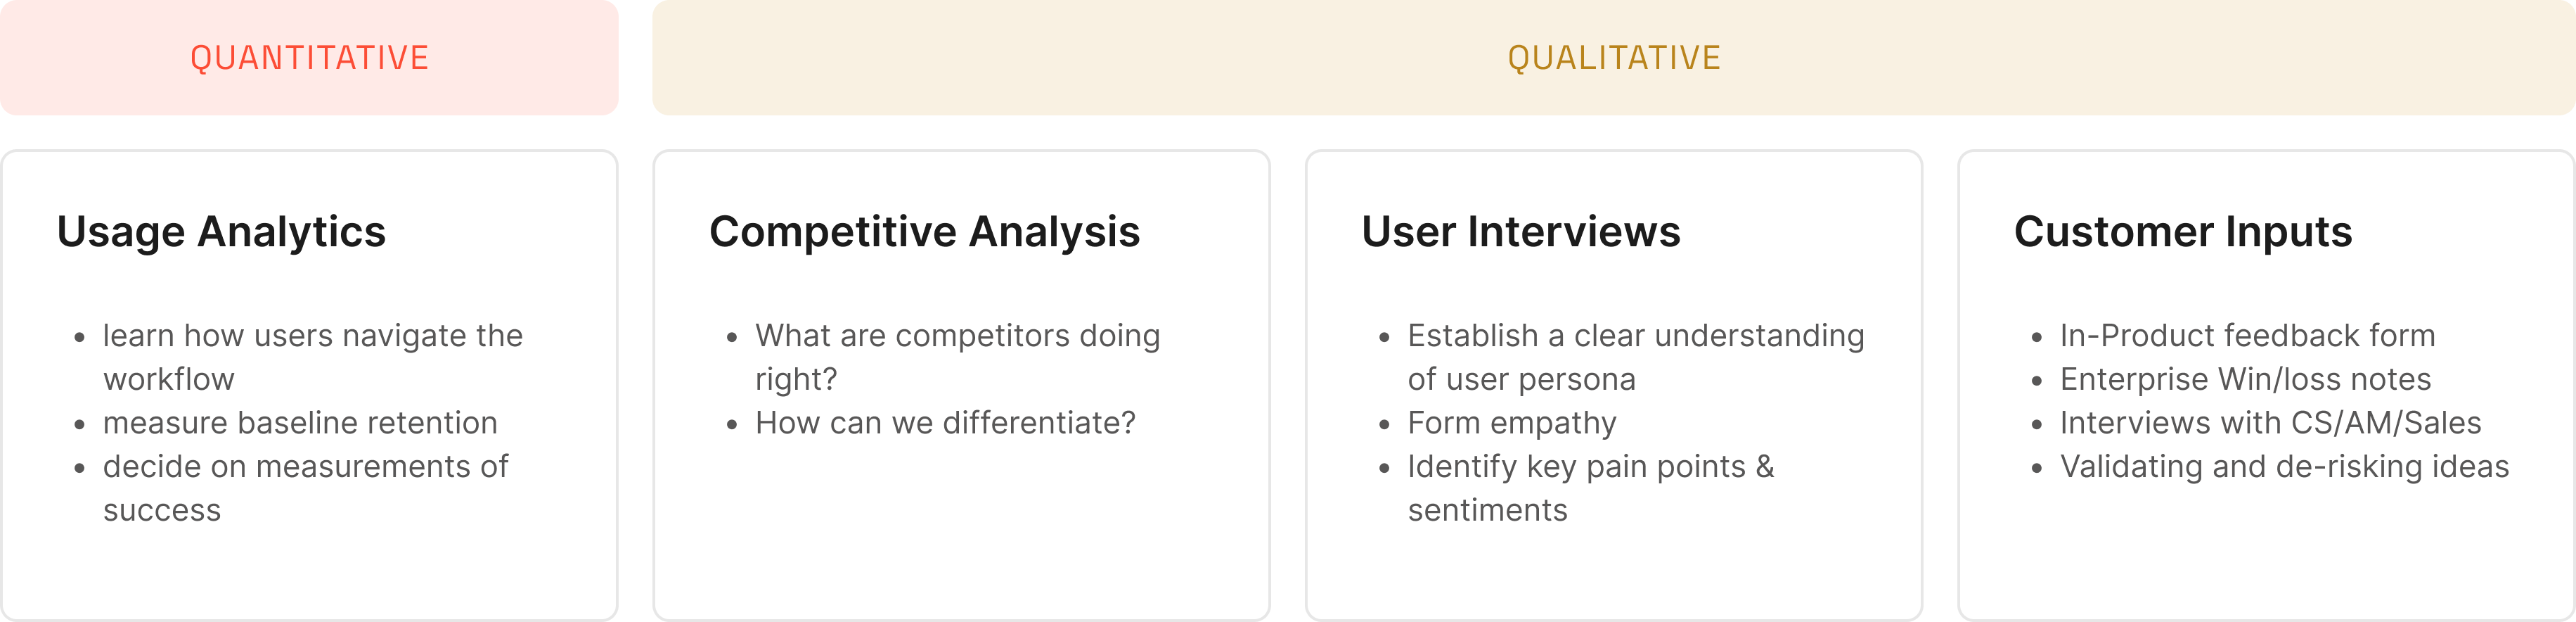
Key Research Insights
Quantitative:
Due to an alert-improvement project my team and I had released 6 months earlier, 51% of users were now signed up to receive notifications when unexpected trends were detected. We had a key opportunity to re-engage 51% of our customers at a critical moment by helping them use Mixpanel to follow-up on alerts.
Qualitative Insights:
Through user interviews, I validated the need for increased workflow speed & captured key feature requests.

Planning & Prioritization
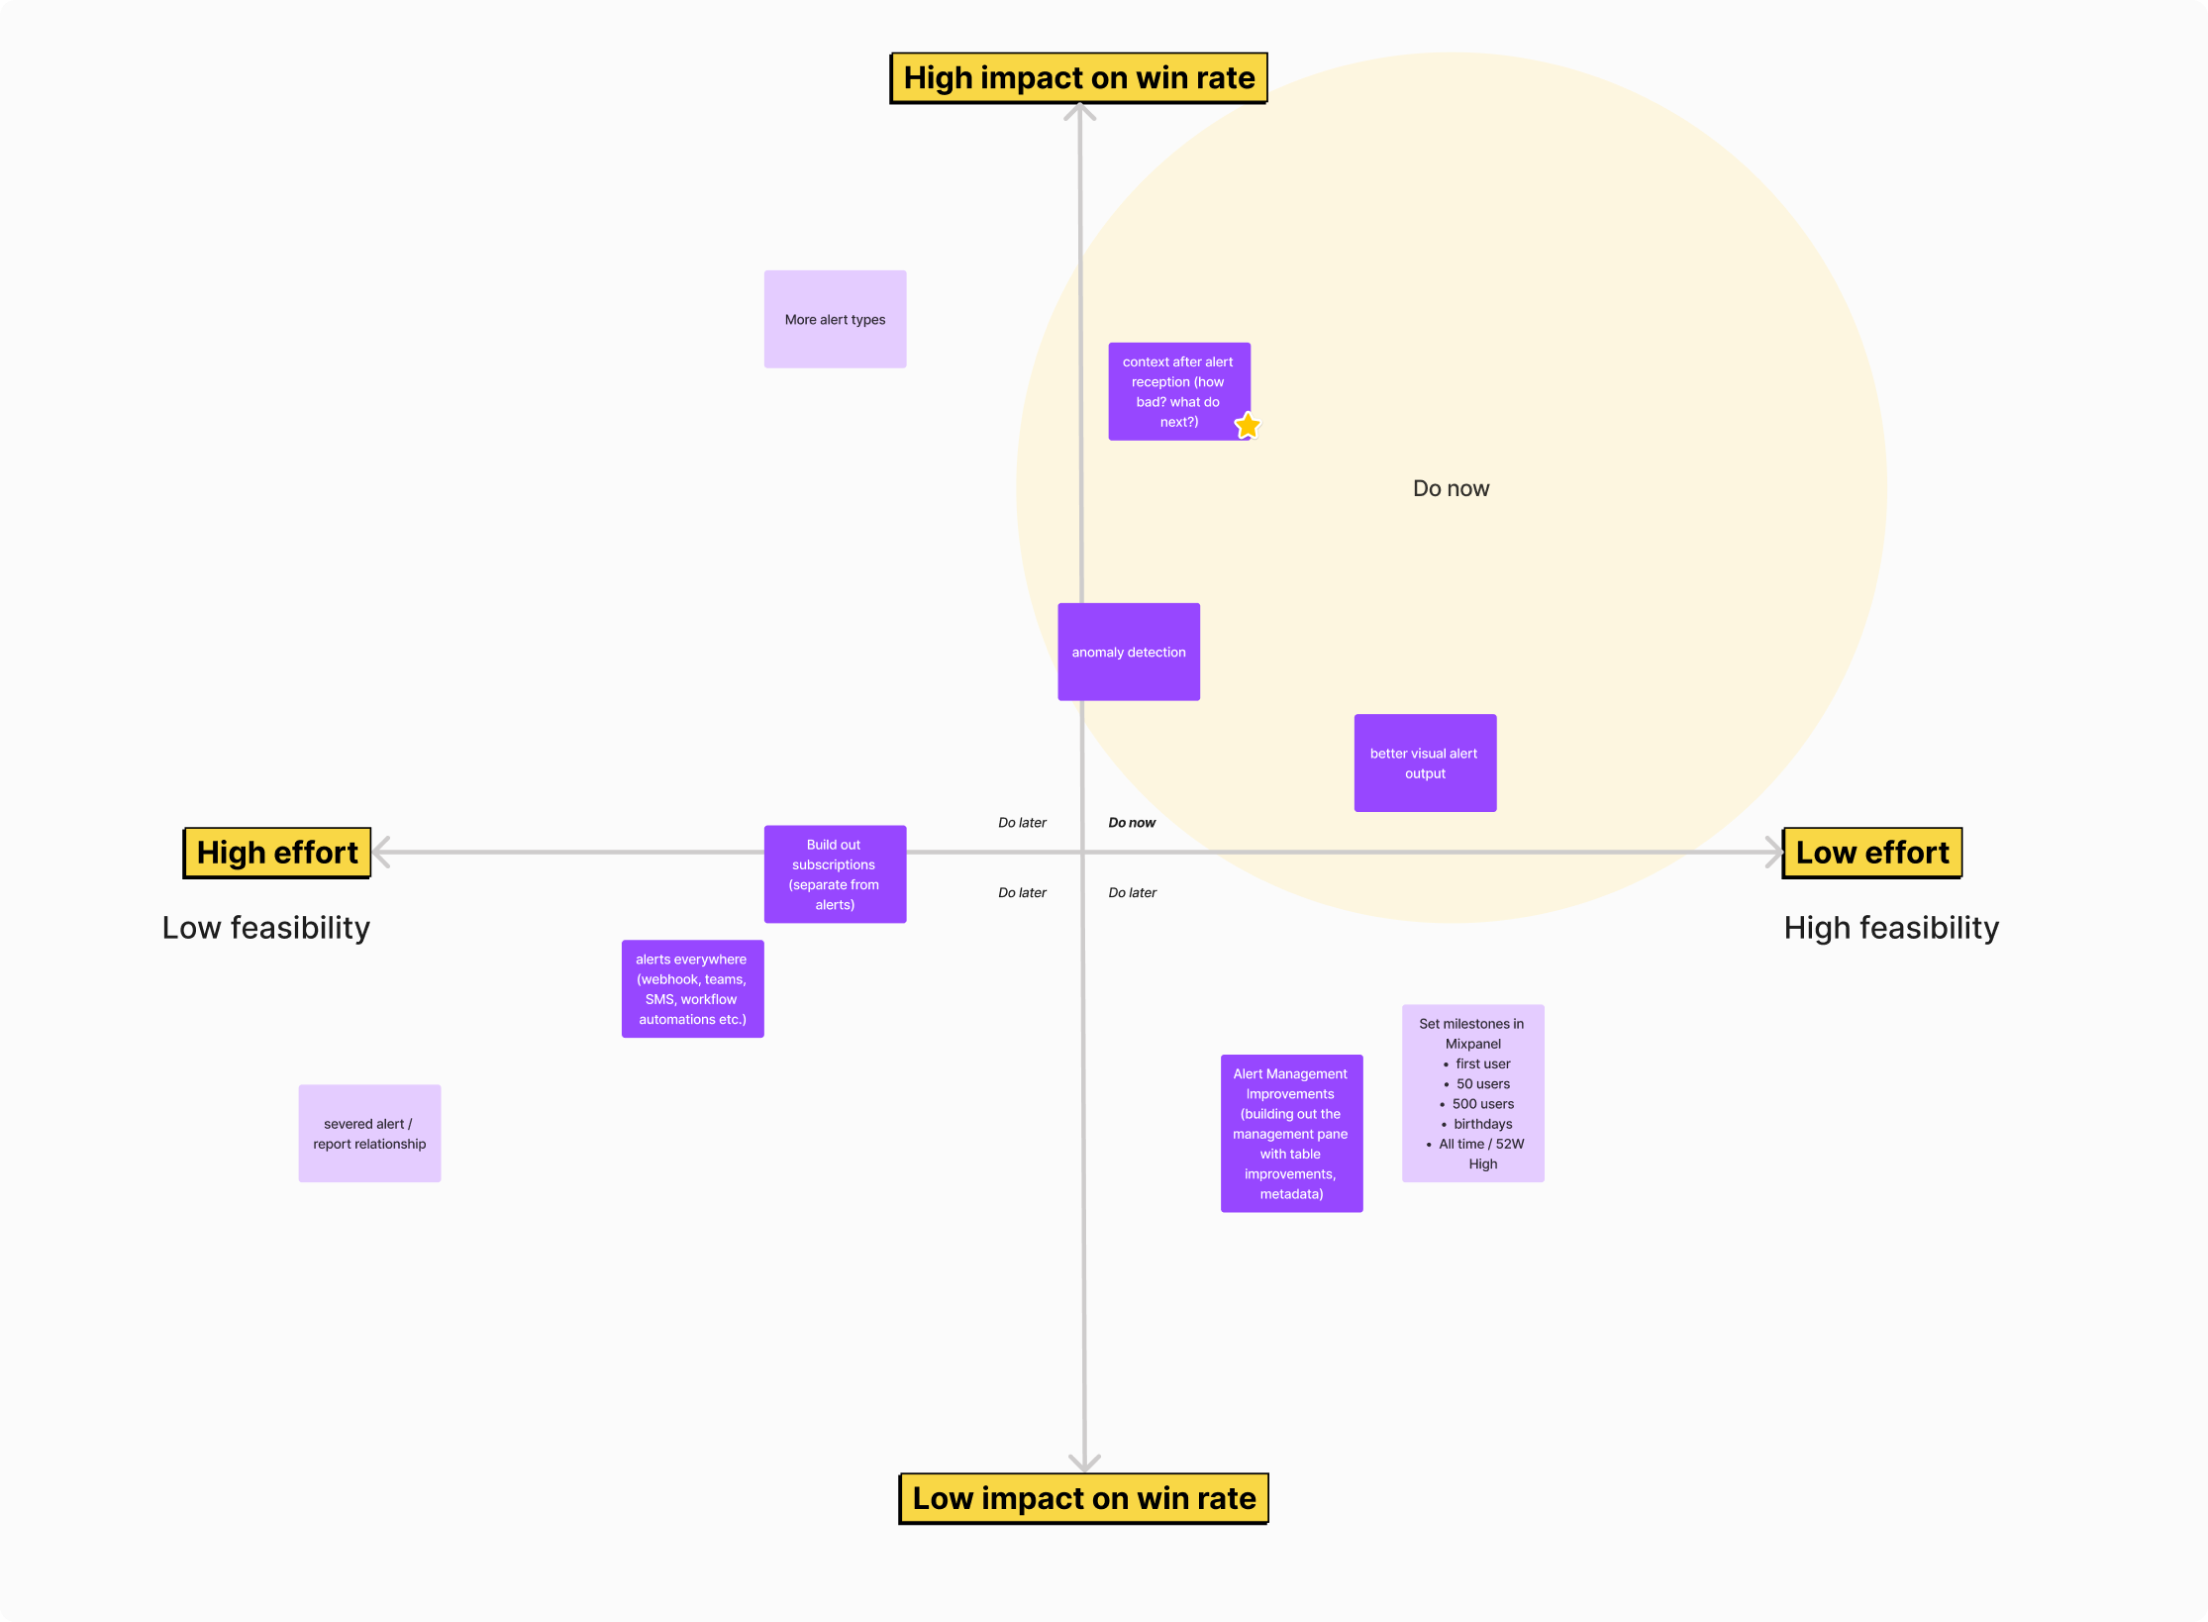
Design Approach
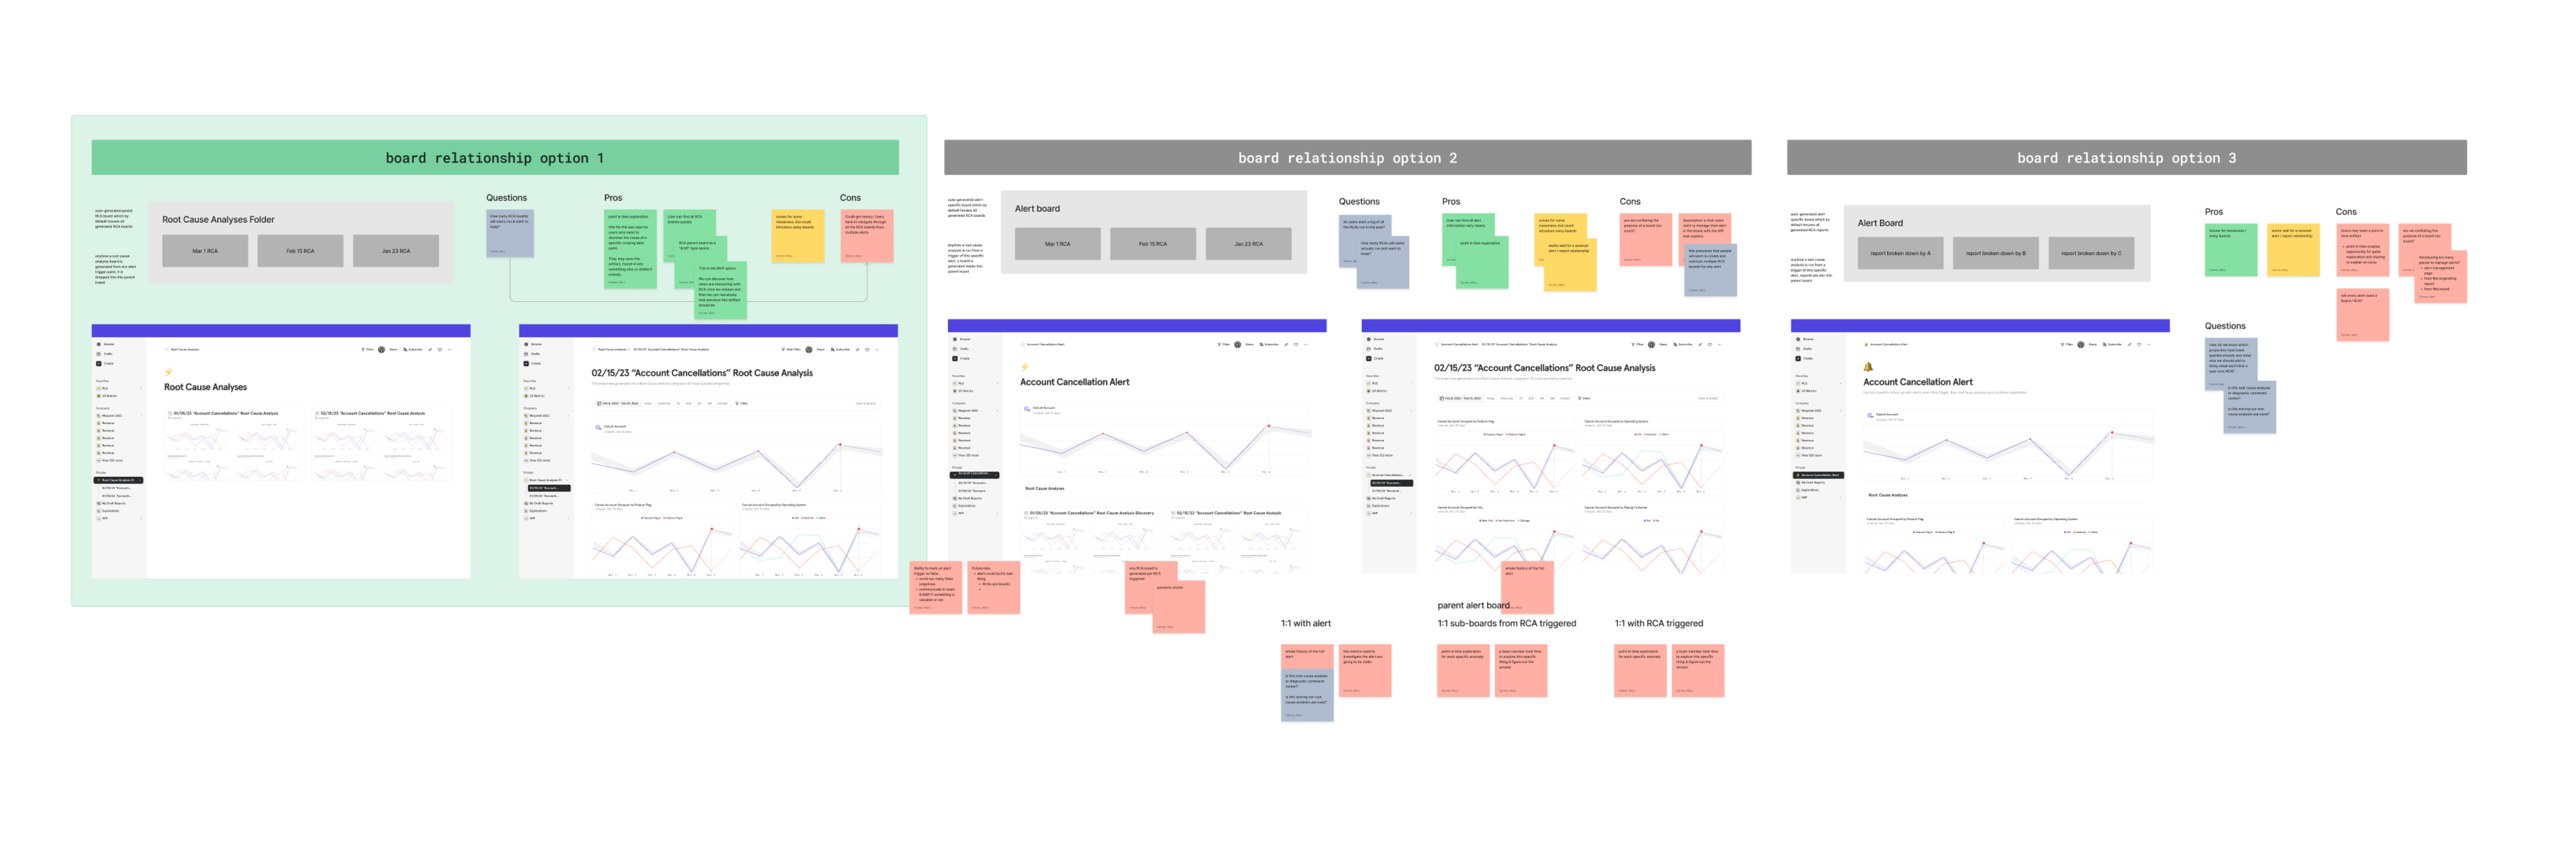
- Solution architecture & Workflow
- Divergent design exploration
- Collaboration & seeking cross-functional input/feedback
- Refinement cycles (internal reviews & user testing)
- Requirement definition & prioritization
- Execution

Outcomes
Solution
Impact
- Business Impact
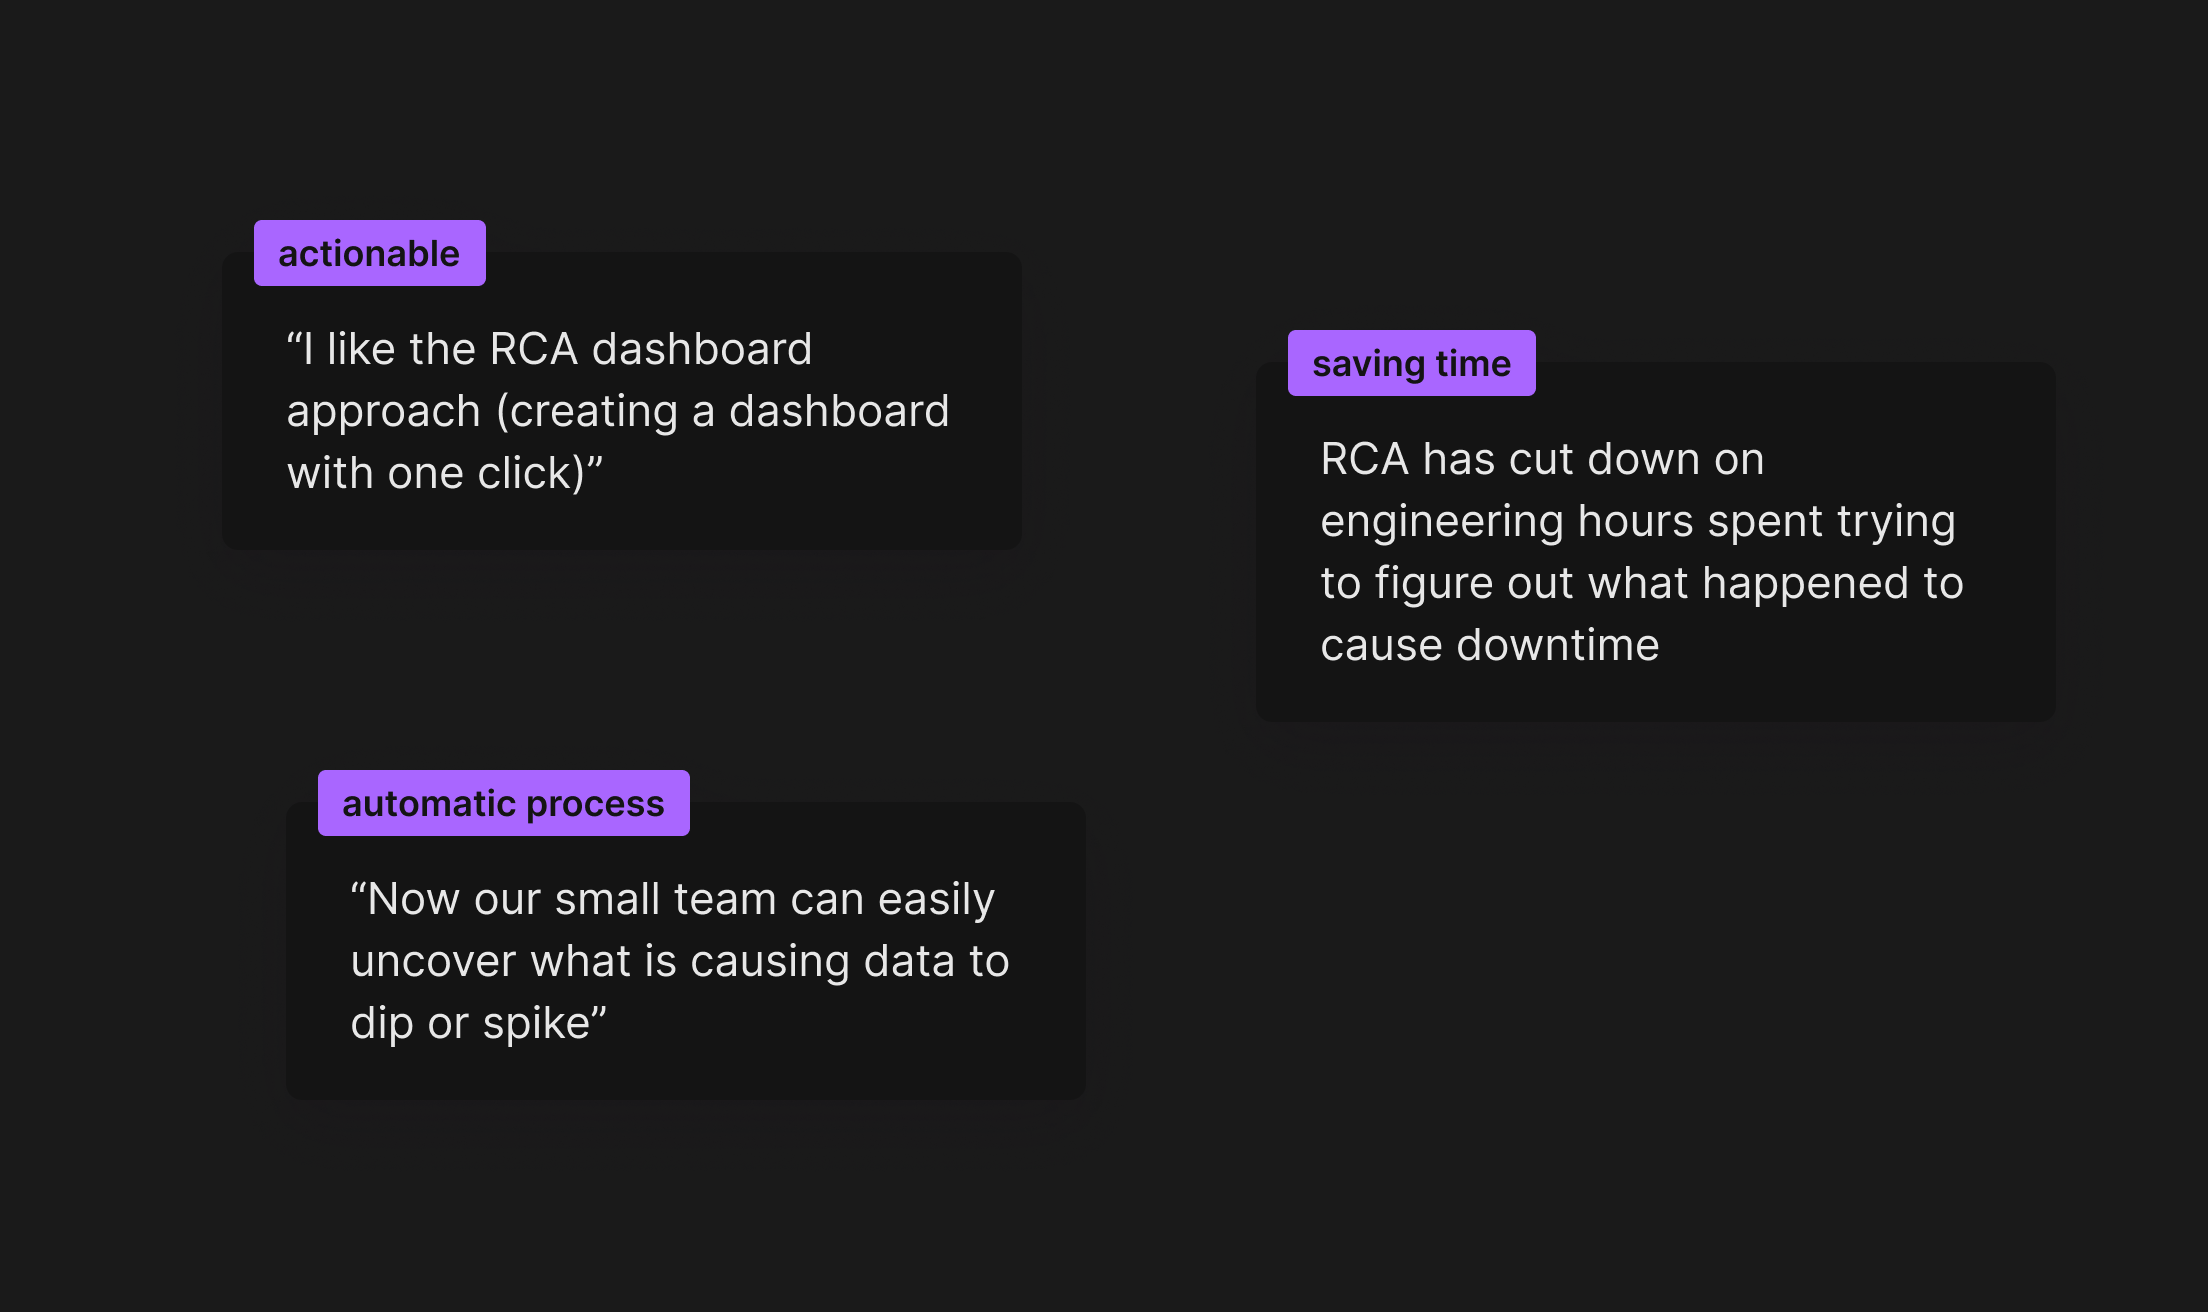
- Product & Customer Impact
Key Learnings